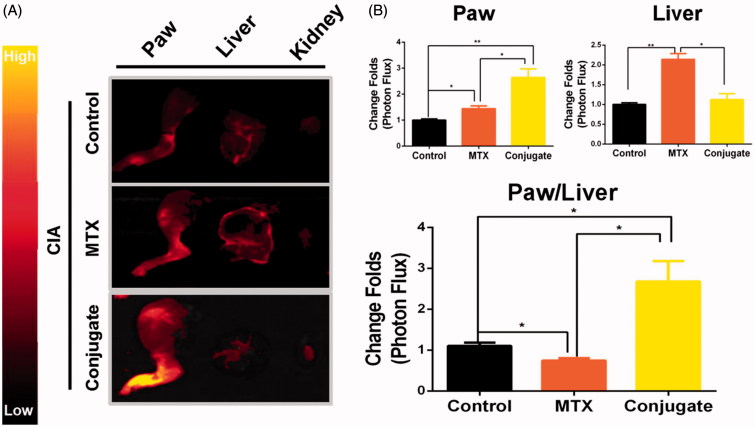
Figure 4.
Selective biodistribution ex vivo. (A) Cy5.5 fluorescence images of isolated paws, livers, and kidneys. (B) Average signals detected in ankle joints of negative control mice treated with Cy5.5, CIA mice treated with Cy5.5, CIA mice treated with MTX, and CIA mice treated with conjugate. n = 3, *p < .05, **p < .01, ***p < .005.

