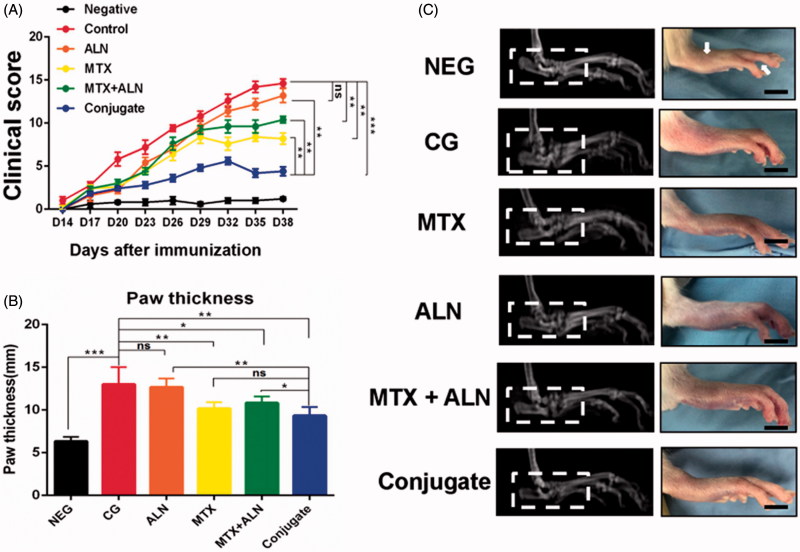
Figure 5.
Efficiency of MTX–ALN in the CIA model. (A) Clinical scores of CIA model are shown. (B) Serial measurements of hind-paw thickness in CIA rats in the control (PBS 1 mg/kg; n = 5), MTX–ALN (1 mg/kg; n = 5), MTX (1 mg/kg; n = 5), ALN (100 µg/kg; n = 5), and MTX (1 mg/kg) with ALN (100 µg/kg) (n = 5) groups. (*p < .05, **p < .01, ***p < .005 compared with controls. ###p < .001, compared with NEG). (C) Macroscopic images of inflamed joints of NEG, CG, MTX, ALN, MTX with ALN, and MTX–ALN groups are shown. NEG: negative control; CG: control; MTX + ALN: free MTX combined with free ALN.

