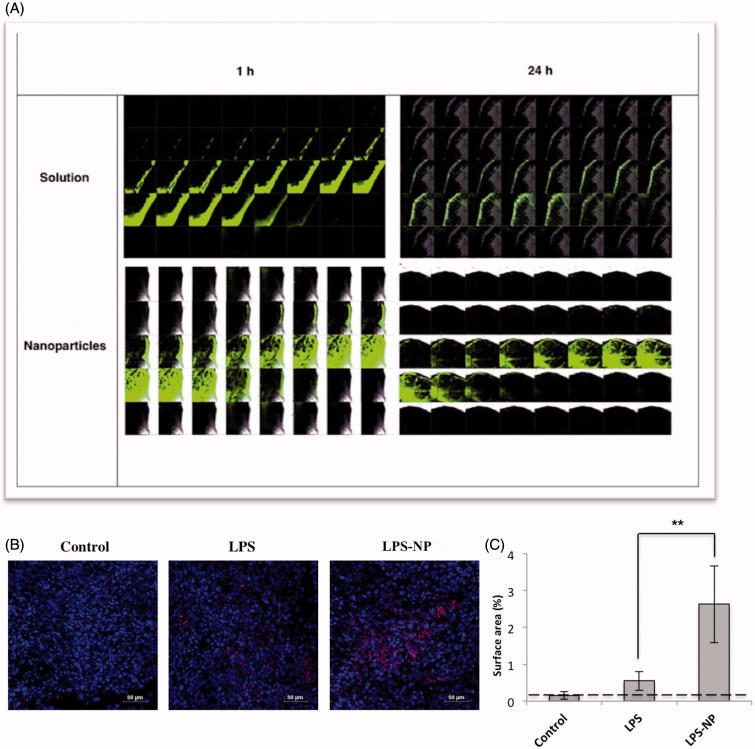
Figure 4.
Microscopic evaluation of the tumor cross-sections. A) Intratumoral LPS penetration and deposition 1 and 24 h after the peritumoral injection of LPS/LPS-NP (100 µg/mL). The width of each individual field and the distance between two consecutive cross sections are 258 and 5 μm, respectively. B) Intratumoral infiltration of macrophages (CD14 + cells) in the animals treated with PBS (control), and 100 µg/mL of LPS or LPS-NP. CD14 + cells are shown in pink while the nuclei are dyed blue. Scale bars represent 10 µm. C) Analysis of the percentage of the CD14 + stained surface area from 10 independent fields captured from various areas of three tumor cross-sections indicating significantly higher intratumoral infiltration of the CD14 + cells in the animals treated with LPS-NP compared to the other groups.

