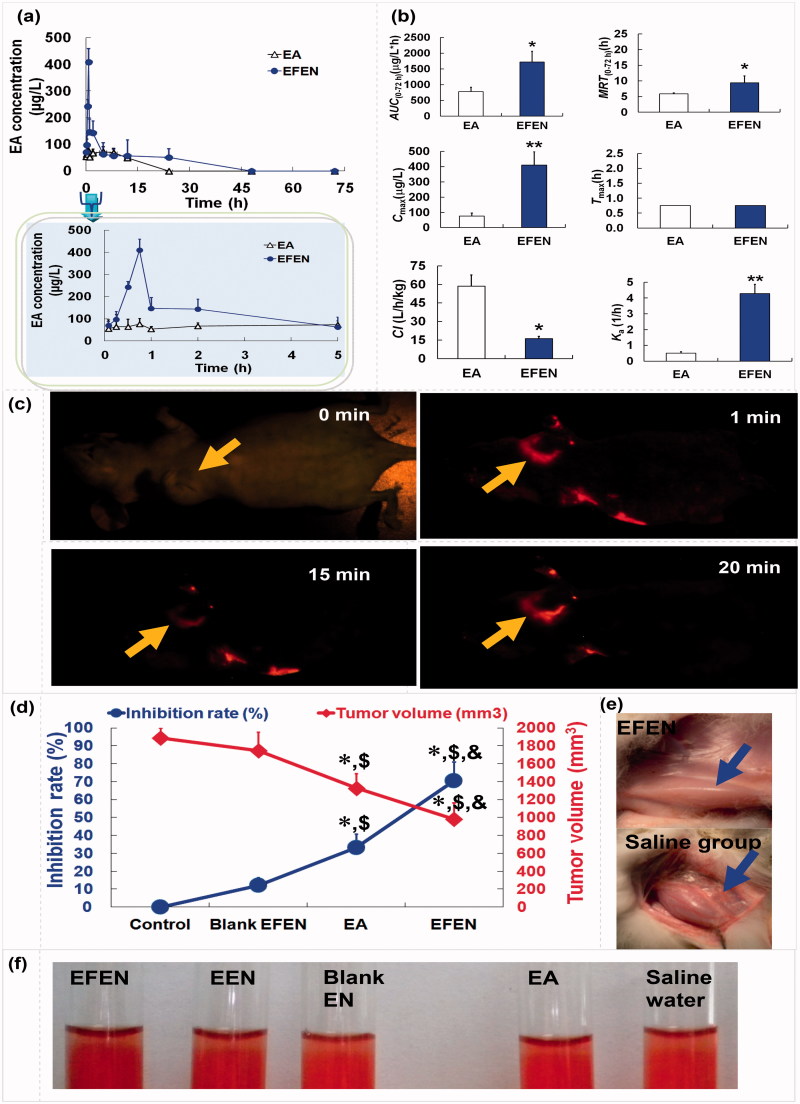
Figure 6.
The in vivo kinetic, distribution characteristics, anticancer effects, and safety of EA and EFEN. (a) Plasma EA concentration versus time profiles; (b) pharmacokinetic parameters of EA and EFEN. The data were shown as mean ± SD. n = 6 rats per group. *p < .05 indicated significant differences between EA and EFEN; (c) accumulation of EFEN at the tumor site after administration; (d) effects of EFEN on cancer sizes and weight, *p < .05 indicated significant differences between the sample group and the control group, $P < .05 indicated significant differences between the sample group and Blank EFEN group, & P <.05 indicated significant differences between the sample group and EA; (e) stimulation; and (f) hemolytic evaluations of EFEN. Normal saline solution was used as the negative control in stimulation and hemolytic tests.

