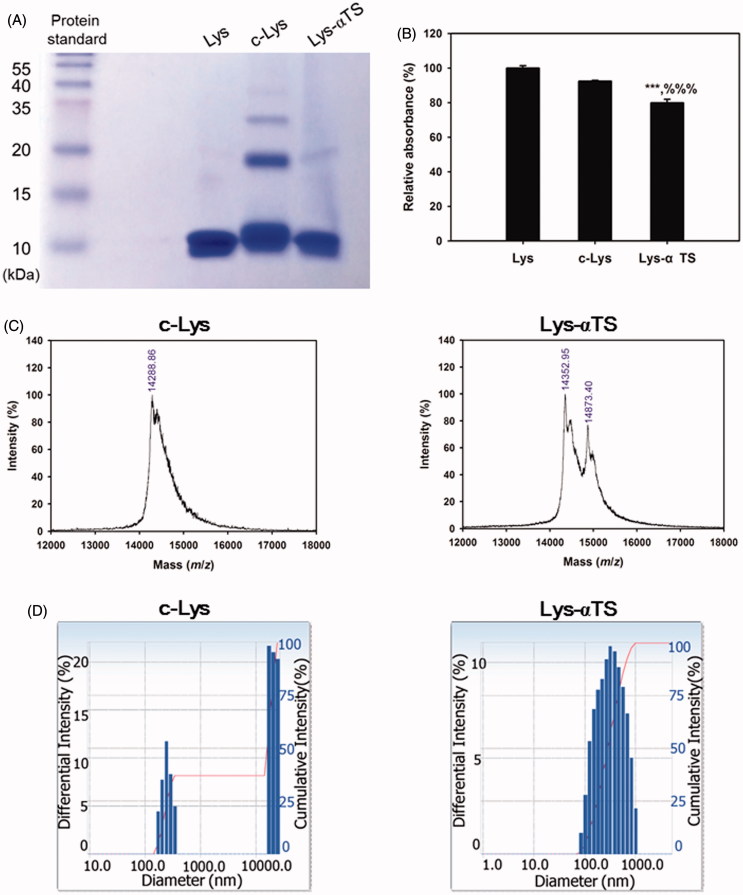
Figure 2.
Synthesis of c-Lys and Lys-αTS and their characterizations. (A) The result of SDS-PAGE assay. Protein standard, Lys, c-Lys, and Lys-αTS were loaded onto the wells for gel electrophoresis. (B) The result of TNBS assay. Each point represents the mean ± SD (n = 3). ***p < .001, compared with Lys group. %%%p < .001, compared with c-Lys group. (C) MALDI-TOF choromatograms of c-Lys and Lys-αTS. Relative intenstiy (%) accroding to mass (m/z) is plotted. (D) Size distribution diagrams of c-Lys and Lys-αTS. Differential intensity according to the diameter is plotted.

