Figure 4.
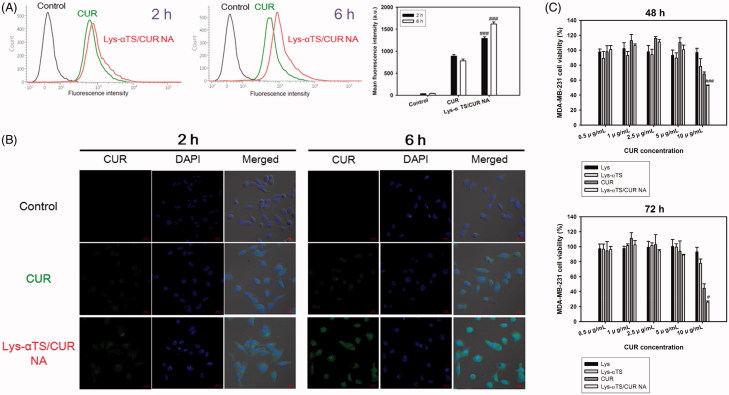
Cellular uptake and antiproliferation studies in MDA-MB-231 cells. (A) Cellular accumulated amounts of CUR quantitatively analyzed by flow cytometry. CUR or Lys-αTS/CUR NA (10 μg/mL CUR concentration) was incubated for 2 and 6 h. Black, green, and red colors indicate control, CUR, and Lys-αTS/CUR NA group, respectively. Each point represents the mean ± SD (n = 3). ###p < .001, compared with CUR group. (B) Intracellular distribution of NPs monitored by CLSM imaging. CUR or Lys-αTS/CUR NA (10 μg/mL CUR concentration) was incubated for 2 and 6 h. Green and blue colors indicate CUR and DAPI, respectively. The length of the scale bar in the image is 20 μm. (C) Antiproliferation assay in MDA-MB-231 cells. Cell viability (%) values of Lys, Lys-αTS, CUR, and Lys-αTS/CUR NA, according to CUR concentrations, are presented after 48 and 72 h incubation. Each point represents the mean ± SD (n = 3). #p < .05, compared with CUR group. ###p < .001, compared with CUR group.

