Figure 5.
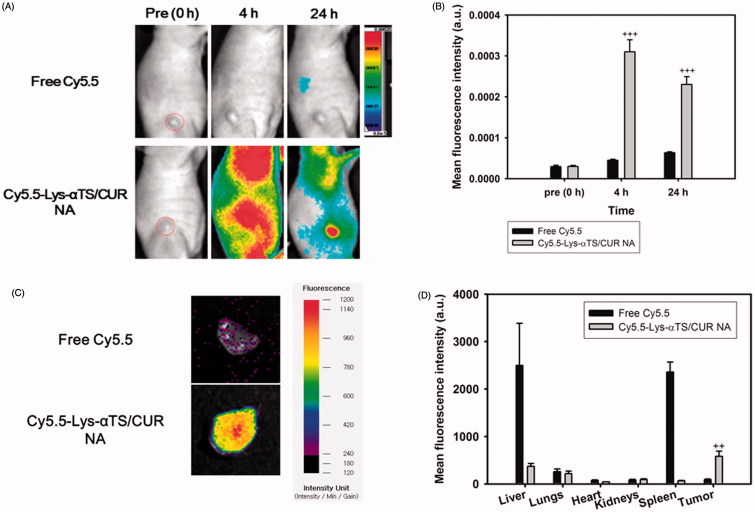
NIRF imaging test in MDA-MB-231 tumor-bearing mouse model. Free Cy5.5 or Cy5.5-conjugated Lys-αTS/CUR NA was injected into the tail vein of the mouse model. (A) Whole body-scanned images acquired at 0 (pre), 4, and 24 h post-injection. Red dashed circle indicates the tumor region. (B) Mean fluorescence intensity values in the tumor region. Each point represents the mean ± SD (n = 3). +++p < .001, compared with free Cy5.5 group. (C) Ex vivo NIRF image of dissected tumor tissues at 24 h post-injection. (D) Mean fluorescence intensity values in liver, lungs, heart, kidneys, spleen, and tumor are presented. Each point represents the mean ± SD (n = 3). ++p < .01, compared with free Cy5.5 group.

