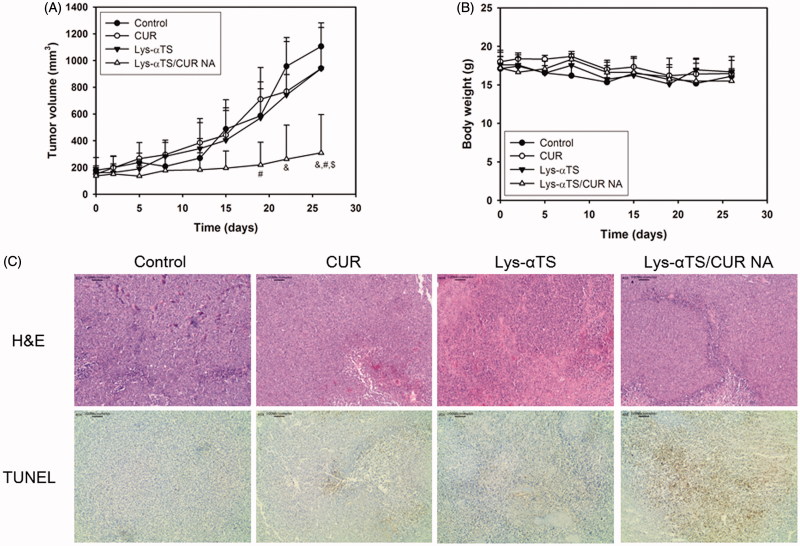
Figure 6.
In vivo anticancer activity tests in MDA-MB-231 tumor-bearing mouse models. (A) Tumor volume profiles of control, CUR, Lys-αTS, and Lys-αTS/CUR NA groups. CUR, Lys-αTS and Lys-αTS/CUR NA were injected intravenously on day 5, 8, 12, 15, 19, and 22, respectively. Each point indicates the mean ± SD (n ≥ 3). &p < .05, compared with the control group. #p < .05, compared with CUR group. $p < .05, compared with Lys-αTS group. (B) Profiles of body weight of control, CUR, Lys-αTS, and Lys-αTS/CUR NA groups. Each point indicates the mean ± SD (n ≥ 3). (C) Staining images of dissected tumor tissues. The microscopic images of H&E staining (upper panel) and TUNEL assay (lower panel) are shown. The length of scale bar in the image is 100 μm.

