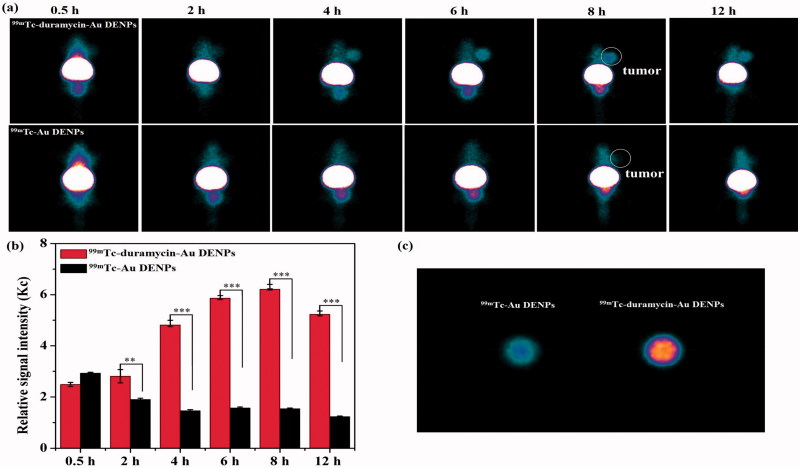
Figure 4.
SPECT images (a) and tumor relative signal intensities (b) of the nude mice bearing C6 xenografted tumors after 3 days of DOX treatment at different time points post-intravenous injection of the 99mTc-duramycin-Au DENPs or 99mTc-Au DENPs. SPECT images of ex vivo tumors at 8 h post-injection (c). The white circle points to the tumor site.

