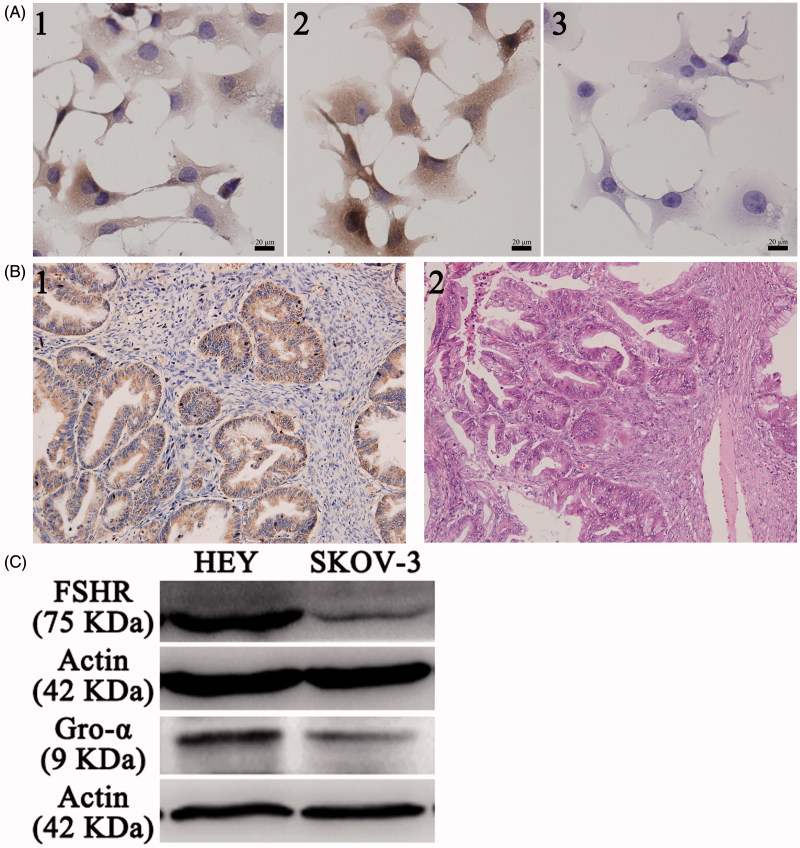
Figure 1.
FSHR and gro-α expression in ovarian cancer cells and tissues. (A) FSHR and gro-α expression in ovarian cancer cells by immunocytochemistry. 1, 2 and 3, HEY cells stained with FSHR antibody, gro-α antibody, and negative control. (B) Gro-α expression in human ovarian cancer tissues (200×). 1, gro-α expression; 2, H&E staining. (C) FSHR and gro-α expression in ovarian cancer cells by Western blot.

