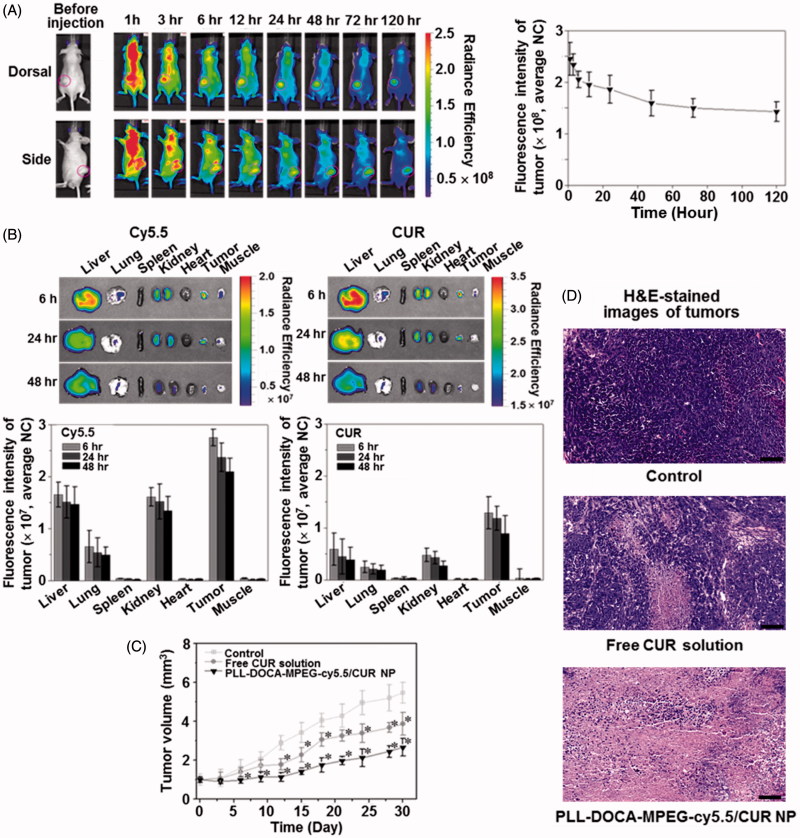
Figure 5.
(A) In vivo whole body NIRF images of Hep3B cancer-bearing mouse models. PLL-DOCA-MPEG-cy5.5/CUR NPs were injected via the lateral tail vein. Real-time images were taken at 0, 1, 3, 6, 12, 24, and 48 hours. The tumor tissues were marked with open pink circles. The whole body images were scanned on the dorsal and side. Fluorescence intensity profiles of cy5.5 and CUR in cancer region over time, which were determined by calculating the fluorescence intensity of cy5.5 and CUR per weight of cancer. Error bars represent mean ± SD (n = 3). (B) Ex vivo NIRF images and fluorescence intensities of cy5.5 and CUR on liver, lung, spleen, kidney, heart, cancer and muscle, measured at 6, 24, and 48 hours after the IV injection. The fluorescence intensities were determined by calculating the fluorescence intensity of cy5.5 and CUR per weight of each organ or tissue. (C) Tumor volume (mm3) and of mice treated with free CUR solution and PLL-DOCA-MPEG-cy5.5/CUR NPs or control on day 30. Free CUR solution and PLL-DOCA-MPEG-cy5.5/CUR NPs were intravenously injected via the lateral tail vein on days 3, 6, 9, 12, 15, 18, 21, and 27. Error bars represent mean ± SD (n = 5); the measurement of the cancer volume was repeated three times (*p < .05 compared with control). (D) H&E-stained images of untreated tumor tissue (control), and dissected tumor tissues treated with free CUR solution and PLL-DOCA-MPEG-cy5.5/CUR NPs on day 30. The black scale bar is 100 μm.

