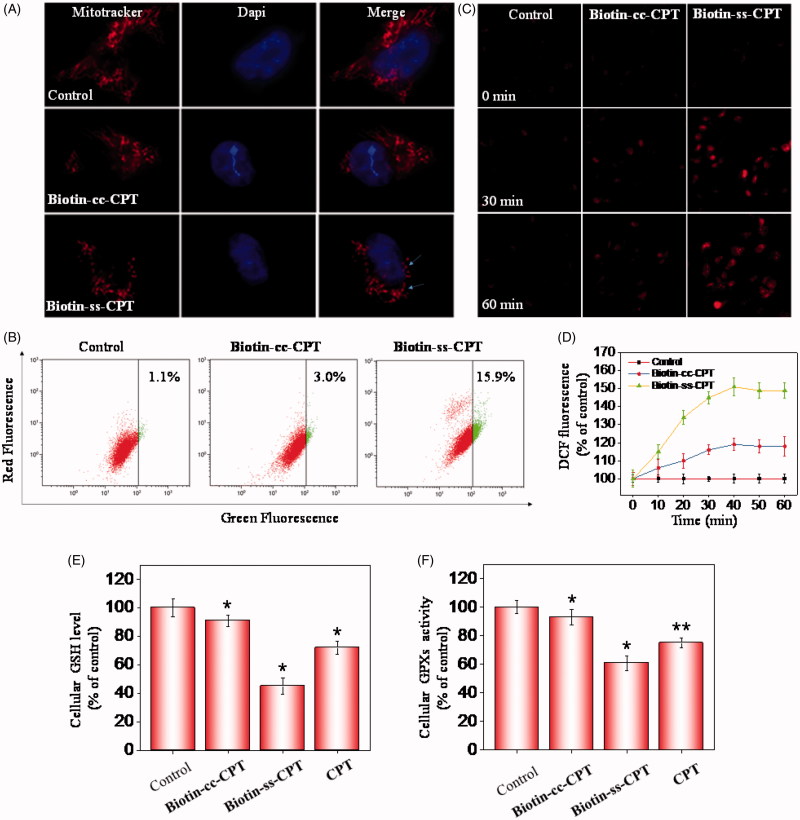
Figure 3.
Induction of ROS-mediated mitochondrial dysfunction and perturbation of GSH/GPXs system. (A) Photomicrographs of mitochondria fission and cytoplasmic shrinkage induced by 1 μM biotin-conjugated CPTs as detected using Mitotracker & DAPI co-staining. The state of mitochondrial fission is indicated by the arrows. (B) Flow cytometric analysis of the changes in ΔΨm on MGC 803 cells treated with Biotin-cc-CPT or Biotin-ss-CPT. The proportion in the right region emitting green fluorescence stands for the percentage of cells that due to the loss of ΔΨm. (C) ROS generation triggered by biotin-conjugated CPTs on MGC 803 cells. Cells incubated with 10 μM DEH in PBS for 30 min were exposed to biotin-conjugated CPTs. (D) ROS generation marked by 10 μM DCF fluorescence. Cells treated with 1 μM of biotin-conjugated CPTs. (E) and (F) Changes in intracellular GSH level and GPXs activity. Cells were treated with 1 μM of biotin-conjugated CPTs. .01 < p ≤ .05 and p ≤ .01 are considered to be statistically significant and highly significant and are denoted as “*” and “**”, respectively. Student’s t test.

