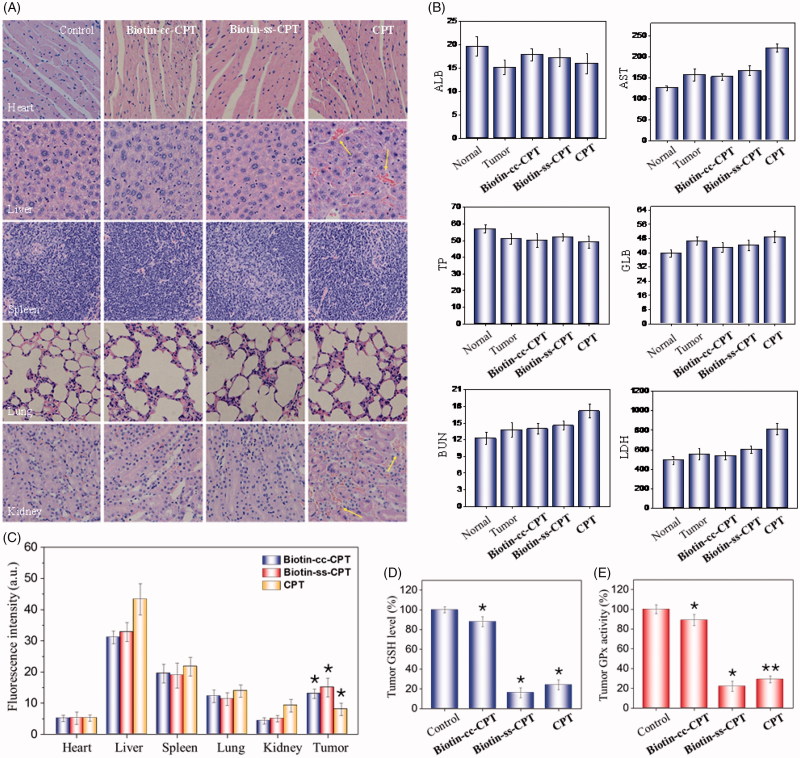
Figure 5.
(A) H & E staining section of heart, liver, spleen, lung, kidney from nude mice after treatment with equivalent dose of 2 mg/kg CPT after 22 days treatment. (B) Blood biochemistry analysis of the indices of ALB, AST, TP, GLB, BUN, and LDH in mice. (C) In vivo biodistribution of different drugs in major organs. (D) Tumor GSH level. (E) Tumor GPx activity. *p < .05, **p < .01. Student’s t test.

