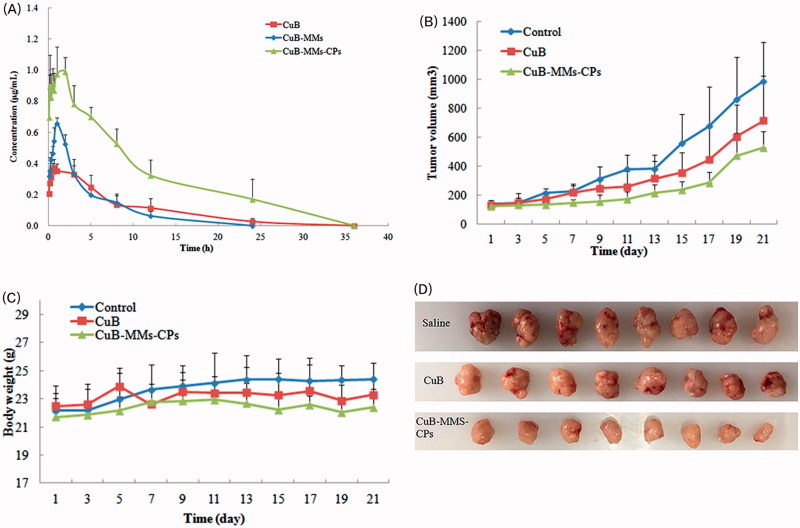
Figure 4.
Time–concentration curve for CuD after oral administration of Cucurbitacin B, CuB-MMs, and CuBMMs-CPs (A) and in vivo antitumor study of normal saline, CuB, and CuB-MMs-CPs in Balb/c nude mice implanted with HepG-2 cells. Tumor volumes (B) and body weight (C) were monitored. Tumor weight was monitored at the end of the experiment (D). The result was presented as the mean ± SD (n = 6).

