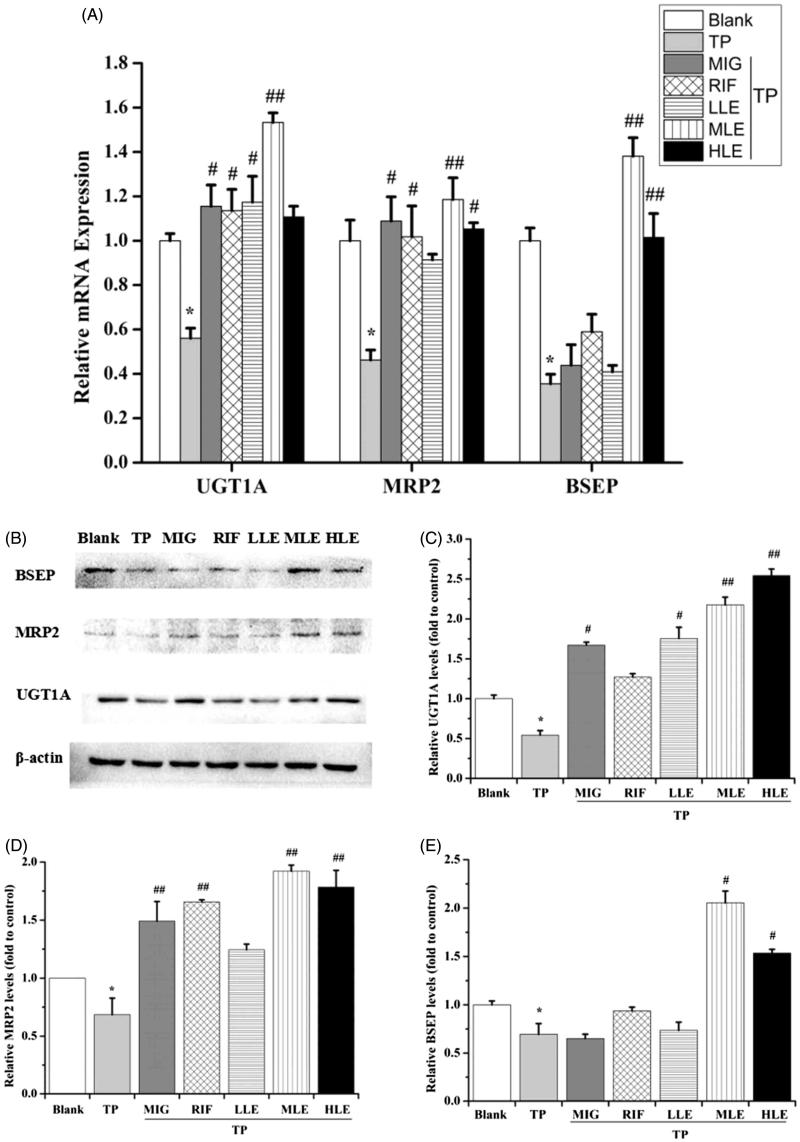
Figure 3.
The effects of LE and MIG on UGT1A, MRP2, and BSEP in L-02 cells exposed to TP. Cells were treated with MIG, RIF or various concentrations of LE for 24 h, and then exposed to 80 nM TP for 18 h. The mRNA expression (A) and protein level (B) of UGT1A, MRP2, and BSEP were measured. Western blot gray value of UGT1A (C), MRP2 (D), and BSEP (E) from (B) are shown (x ± s, n = 6). *p < .01 versus control; #p < .05 versus TP group; ##p < .01 versus TP group.

