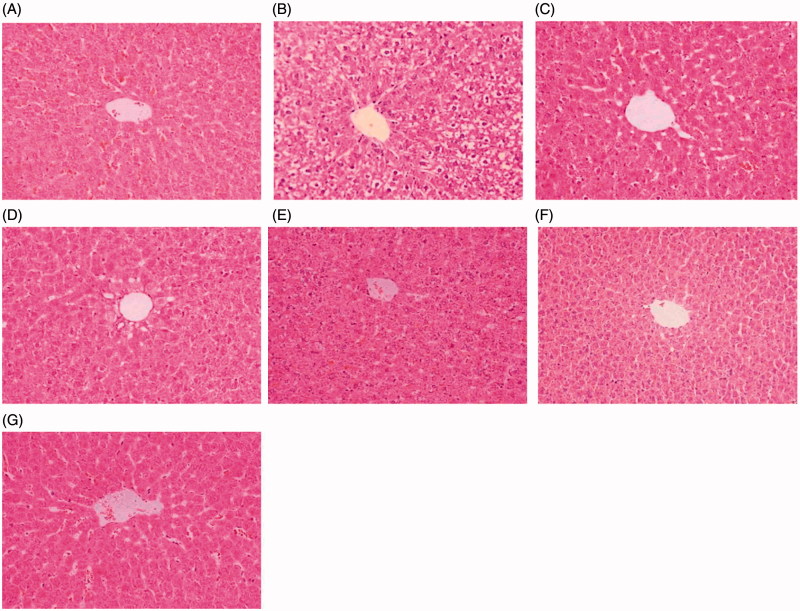
Figure 4.
Photomicrographs of HE-stained liver sections. Tissues were divided into 3-mm sections and stained with hematoxylin and eosin for light microscopic analysis. The photomicrographs are of livers obtained from (A) Control group, (B) TP group, (C) MIG + TP group, (D) RIF + TP group (E) LLE + TP group, (F) MLE + TP group, (G) HLE + TP group.

