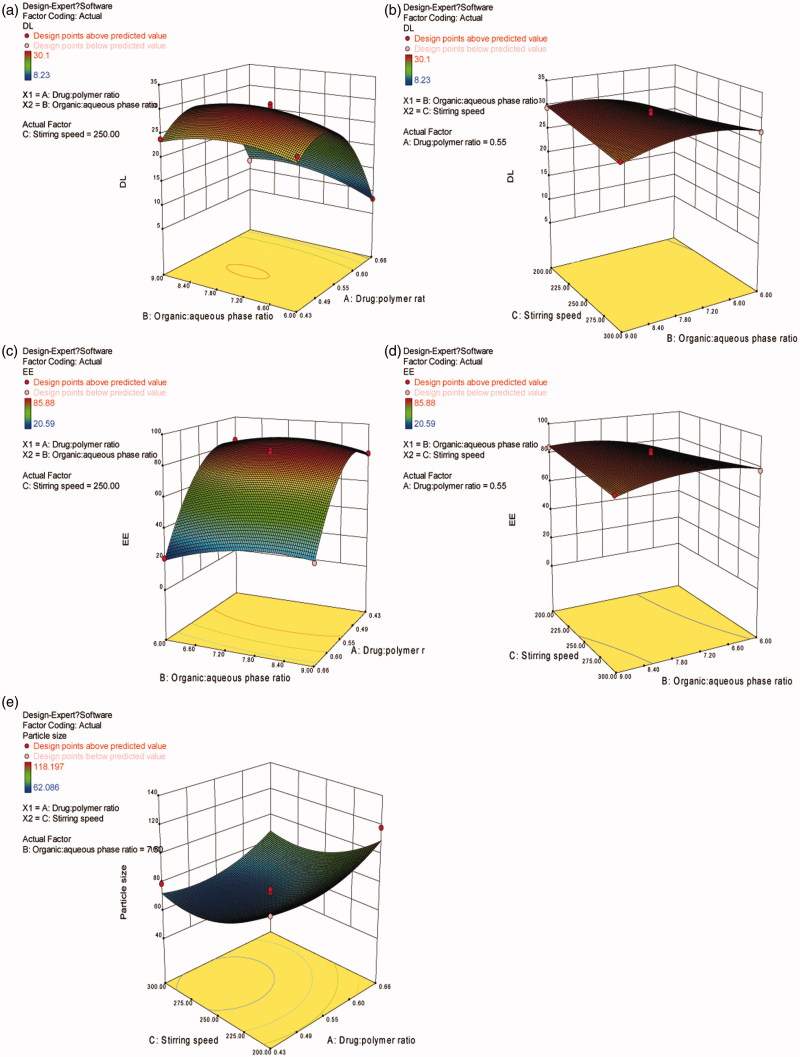
Figure 2.
Response surface plots illustrating the effect of ratio of drug to polymer and ratio of organic to aqueous phase on (a) drug loading and (c) encapsulation efficiency (fixed stirring speed = 250 rpm), ratio of organic to aqueous phase and stirring speed on (b) drug loading and (d) encapsulation efficiency (fixed ratio of drug to polymer =1:1.8), ratio of drug to polymer and stirring speed on (e) particle size (fixed ratio of organic to aqueous phase = 7.5:1).

