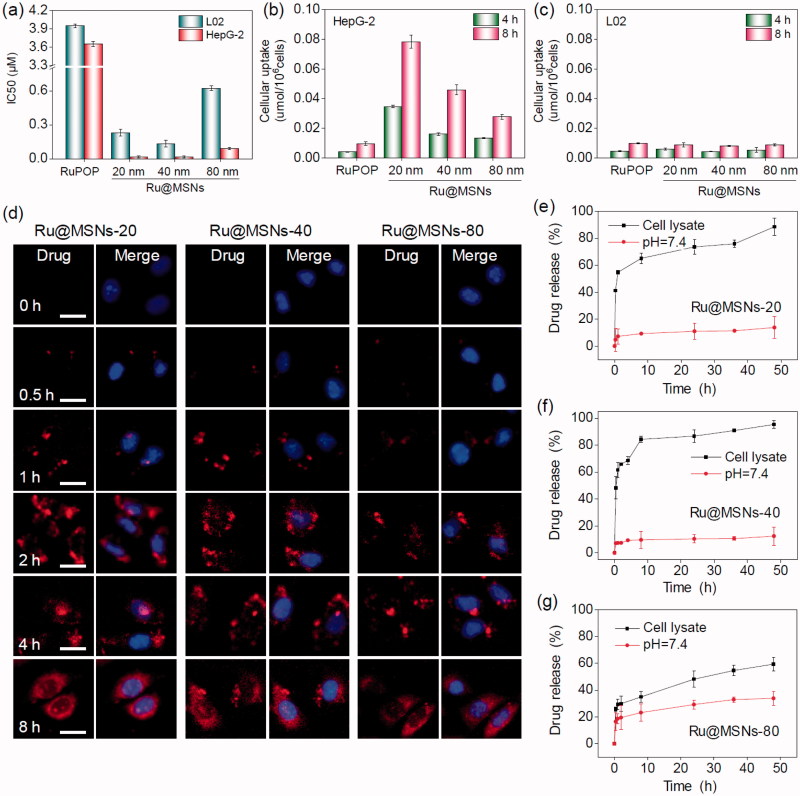
Figure 2.
Anticancer activity and the selective cellular uptake of Ru@MSNs in vitro. The drug concentration in all biological studies was calculated as RuPOP by ICP-MS analysis. (a) IC50 for the RuPOP and different-sized Ru@MSNs toward HepG2 tumor cells and L02 normal cells. Cellular uptake of different-sized Ru@MSNs in HepG2 (b) and L02 (c) cells for 4 and 8 h. Cells were treated with 1 μM of different-sized Ru@MSNs and free RuPOP. (d) Localization of the different-sized Ru@MSNs (red) in HepG2 cells. The cells were treated with 1 μM of Ru@MSNs. (e), (f), and (g) in vitro drug release for the different-sized Ru@MSNs in PBS at pH =7.4 and cells lysate. The scale bar is 20 μm. Value represents means ± SD (n = 3).

