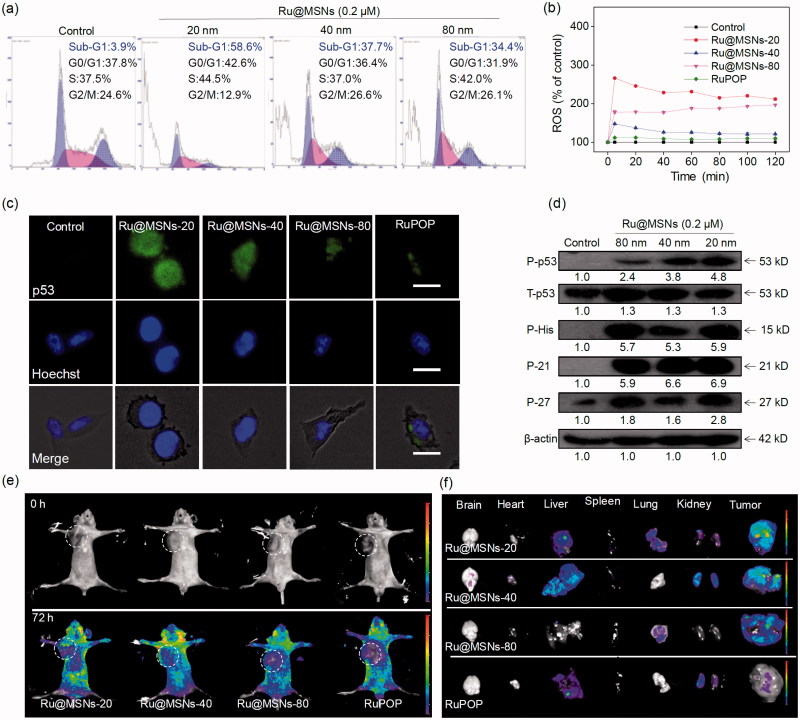
Figure 3.
(a) Flow cytometric analysis of HepG2 cells (2 × 10⁴ cells/mL) exposed with 0.2 μM of different-sized Ru@MSNs for 24 h. (b) ROS overproduction in HepG2 cells (2 × 10⁵ cells/mL) exposed to RuPOP and Ru@MSNs (1 μM) for 2 h. (c) Immunofluorescence of phosphorylated p53 in HepG2 cells with different-sized Ru@MSNs and free RuPOP at 1 μM. The scale bar is 20 μm. Value represents means ± SD (n = 3). (d) Activation of p53 signal pathway in HepG2 cells exposed to different-sized Ru@MSNs. (e) Fluorescence imaging monitor the accumulation and distribution of the different-sized Ru@MSNs in HepG2 xenograft nude mice at 72 h. The treated concentration was 0.2 mg/kg of Ru@MSNs. (f) Fluorescence imaging of the main organs in 72 h-treatment with Ru@MSNs and free RuPOP.

