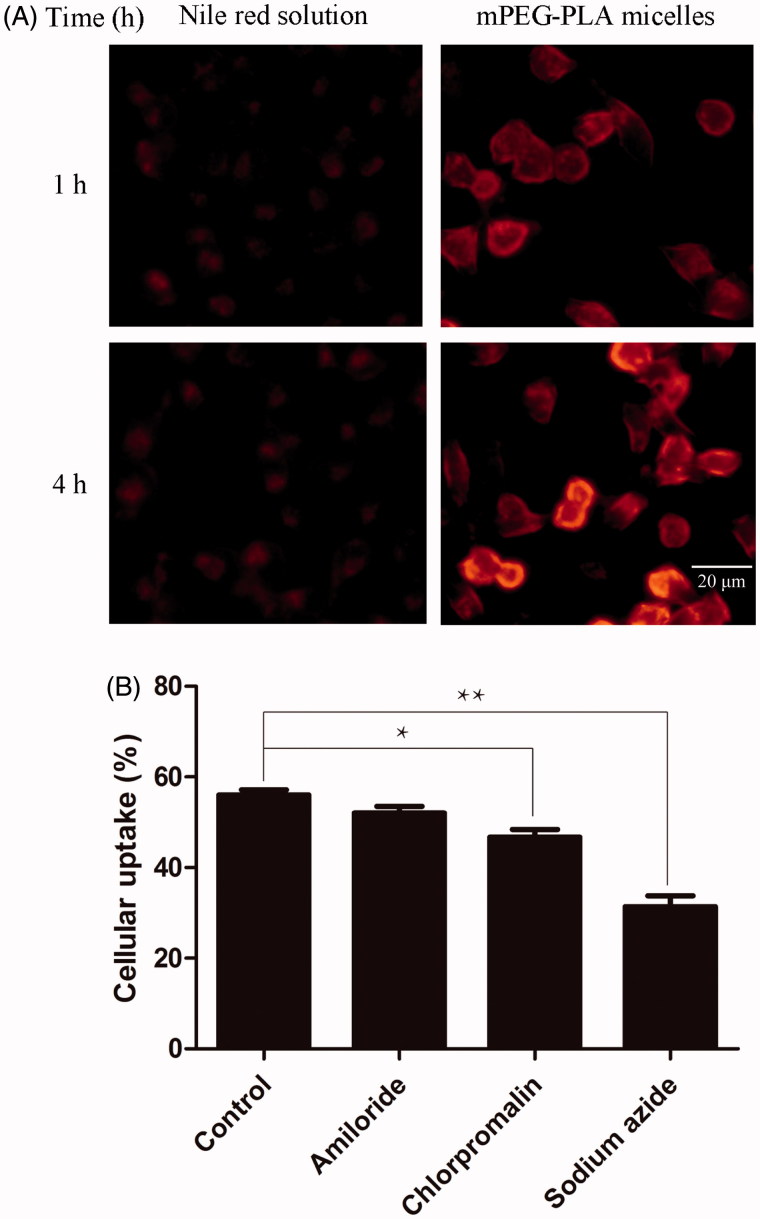
Figure 5.
Cellular uptake of nile red by HCE-2 cells. (A) Photographs of representative series of cells exposed to 1 μl/ml nile red reference solution and mPEG-PLA micelles for 1 h and 4 h, respectively. (B) These histograms showed the cellular uptake efficiency (%) of different inhibitors on HCE-2 cells (n = 3, mean ± SD). * and ** indicated p < .05 and p < .01 versus control group.

