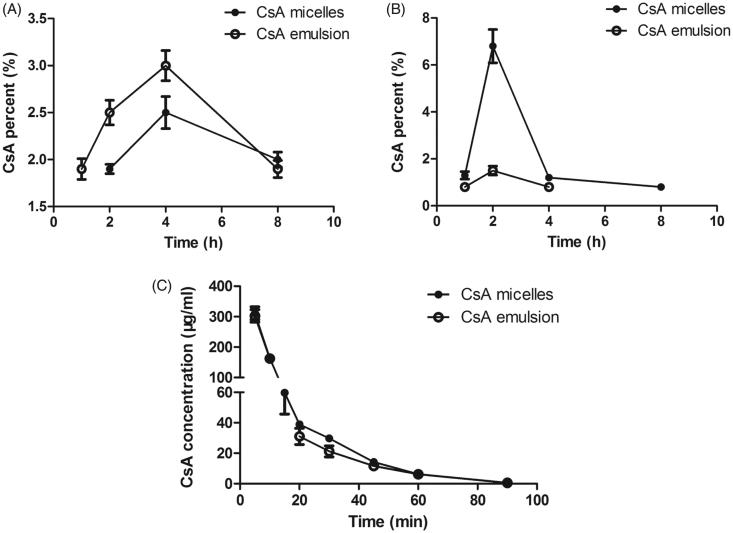
Figure 6.
CsA percent-time profiles of CsA after instillation of CsA micelles and CsA emusion in the (A) aqueous humor and (B) corneal (n = 3, mean ± SD). (C) Concentration of CsA in rabbit tear fluid as a function of time after instillation of the CsA loaded mPEG-PLA micelles and 5% CsA emulsion (n = 6, mean ± SD).

