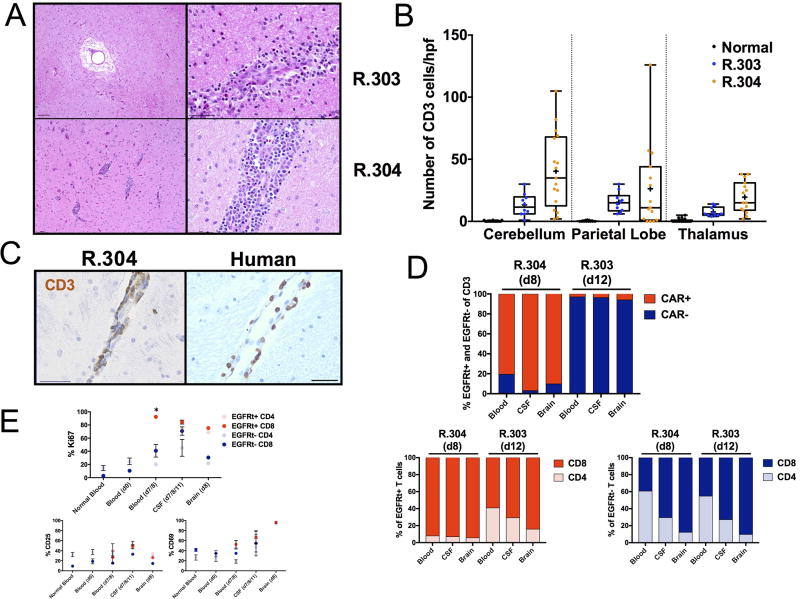
Fig 5. Perivascular T cells and infiltrative encephalitis by EGFRt+ (CD20 CAR) and EGFRt− (non-CAR) T cells following adoptive transfer of RM CD20 CAR T cells.
A, H&E brain sections show focal perivascular edema (top left) and focal perivascular inflammation (top right) in R.303 and multifocal perivascular infiltration in the basal ganglia (bottom left) and parietal lobe (bottom right) in H&E sections in R.304. Scale bars, left: 100 µm; right: 50 µm). B, Enumeration of CD3+ T cell infiltration (quantified in 10–15 fields/brain region section at 20× magnification) in the cerebellum, parietal lobe and thalamus in normal RM, in R.303 (blue) and in R.304 (orange). Individual dots represent the number of CD3+ T cells per high power field. Box and whiskers represent the minimum and maximum range, 25th and 75th percentiles and the median range for all quantified fields in one section, + symbols indicate the mean. C, Cerebral perivascular CD3+ T cell infiltration in RM (R.304) and in human brain of a patient with neurotoxicity after CD19 CAR T cell therapy. Scale bars: 50 µm. D, Percent EGFRt+ (CD20 CAR, red) and EGFRt− (non-CAR, blue) T cells and CD8:CD4 proportions in EGFRt+ (bottom left) and EGFRt− (bottom right) compartments in the blood, CSF and brain on day 8 (d8, R.304) and day 12 (d12, R.303). E, Fraction (%) of EGFRt+ or EGFRt− CD4 an CD8 T cells expressing Ki-67, CD25 or CD69 in the blood of normal RM controls (n = 5), on day 0, pre-CD20 CAR infusion (d0, n = 4) and on day 7 or 8 (peak CD20 CAR expansion, (days 7–8, n = 4)), in the CSF (on day 7 (R.302), day 11 (R.303) and day 8 (R.304); days 7–8/11, n = 3) and in the brain (on day 8 (d8) in R.304, n = 1). * P < 0.05.

