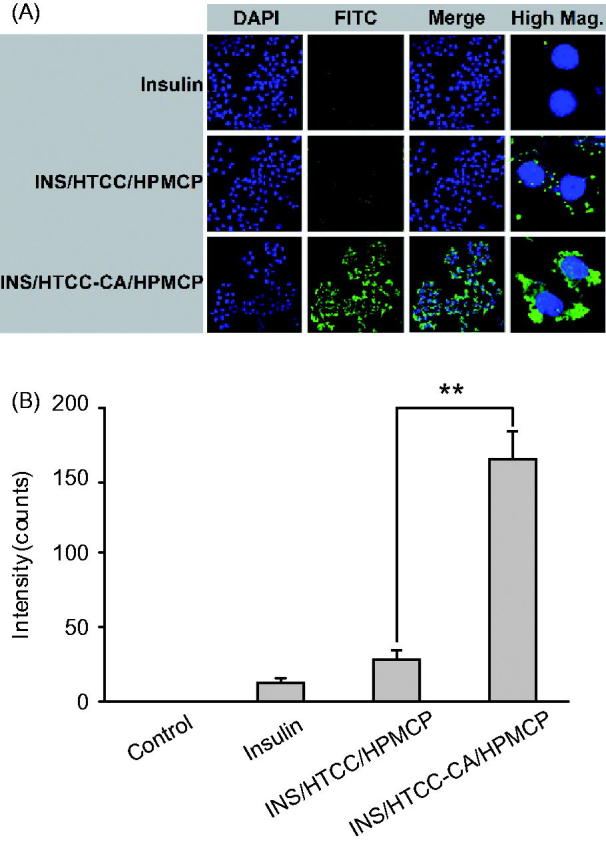
Figure 3.

HepG-2 cellular uptakes after 4 h incubation with FITC-INS, FITC-INS/HTCC/HPMCP, and FITC-INS/HTCC-CA/HPMCP at insulin concentration of 50 μg/mL. (A) CLSM images of HepG-2 cells, and (B) geometric mean values of FITC-INS fluorescence intensities of the flow cytometry analysis (n = 3). The cell nuclei were stained with DAPI. **p < .01.
