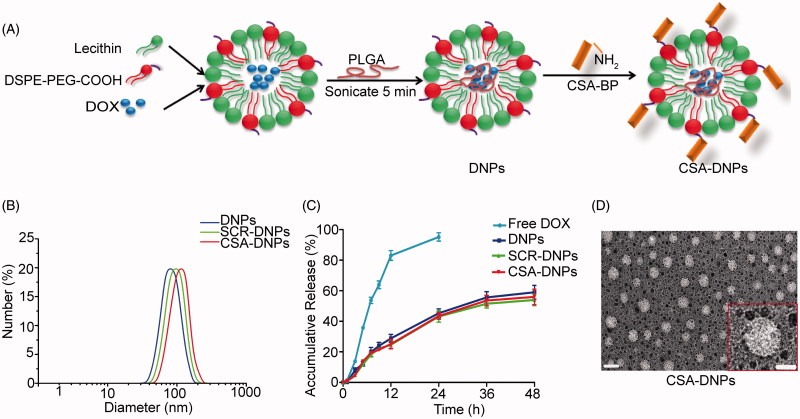
Figure 1.
Synthesis and characterization of CSA-DNPs. (A) Schematic illustration of the single-step sonication method to synthesize CSA-DNPs. (B) Size distribution of the different nanoparticles. (C) DOX release profiles of free DOX, DNPs, SCR-DNPs, and CSA-DNPs in PBS. The data are shown as the means ± SD (n = 3). (D) TEM image of the CSA-DNPs. The scale bar represents 100 nm (left) and 50 nm (right).

