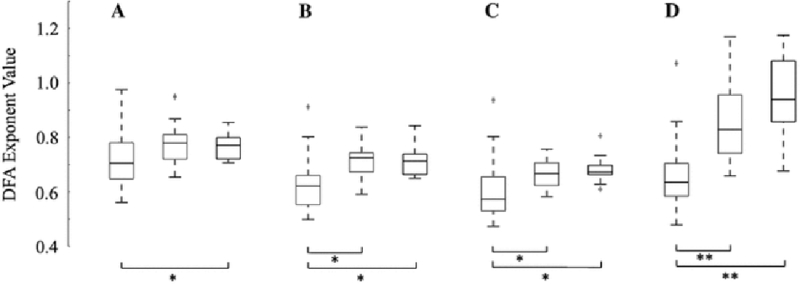
Fig. 5.

Hypsarrhythmia is associated with lower values of the DFA exponent (* = p<0.0125, ** = p<0.0001). Results are shown for a delta band (z = −2.54), b theta band (z = −3.64), c alpha band (z = −3.77), and d beta band (z = −5.03). Z-values report significance between hypsarrhythmia and controls. The red box designates hypsarrhythmia (n=25), blue indicates no hypsarrhythmia (n=17), and black represents control patients (n=21). Patients with intermittent hypsarrhythmia are included in the hypsarrhythmia boxplot
