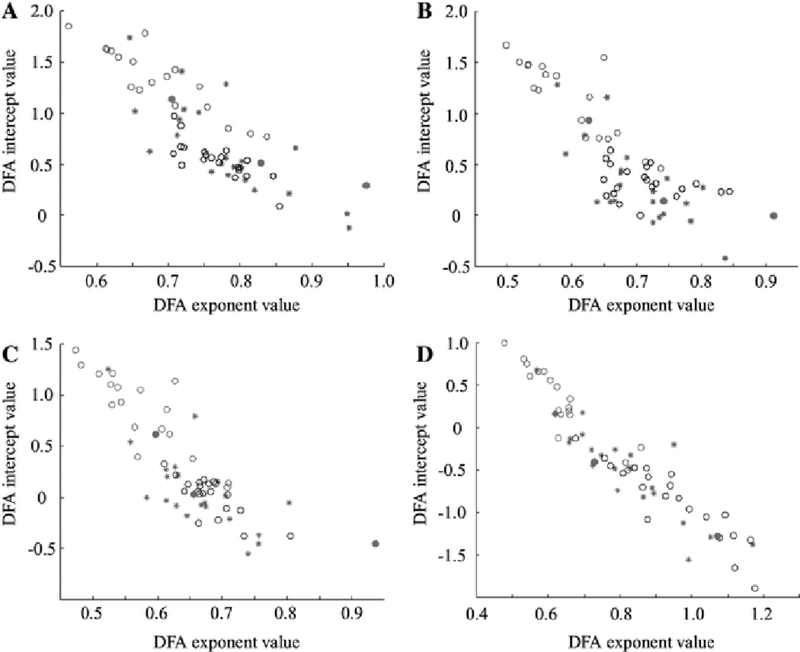
Fig. 6.

A plot of DFA exponent versus DFA intercept results in separation of patients with hypsarrhythmia from those without, enabling classification. Red open circles designate hypsarrhythmia pre-treatment and magenta closed circles indicate intermittent hypsarrhythmia pre-treatment. The red and blue stars indicate hypsarrhythmia and no hypsarrhythmia post-treatment, respectively. Black open circles represent control subjects. Results are shown for the a delta, b theta, c alpha, and d beta frequency bands
