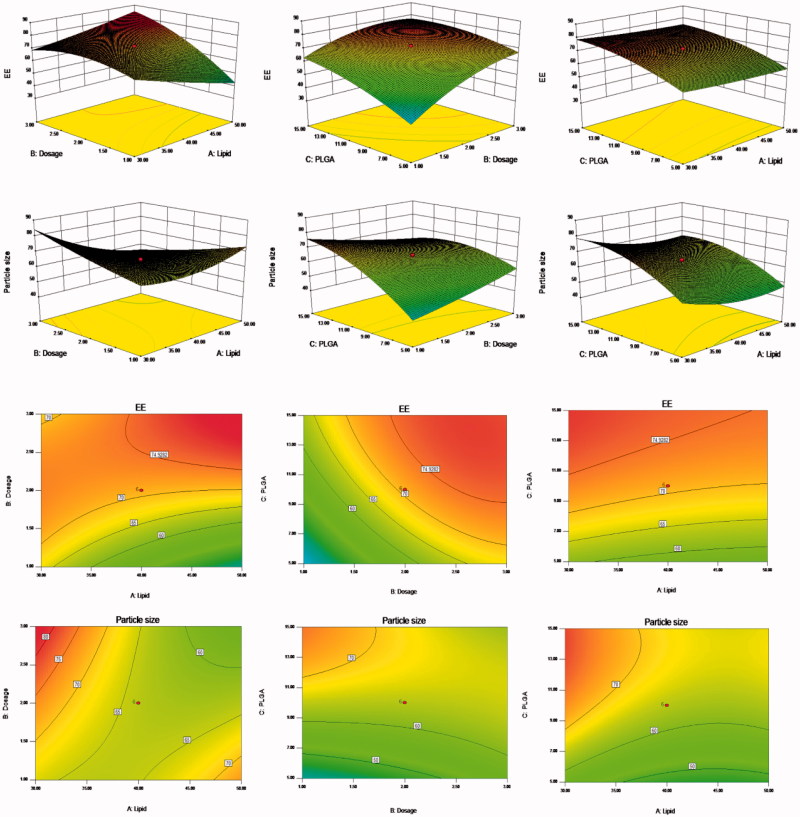
Figure 1.
Response surfaces of the lipid content, PSO dosage, and PLGA content of PSO-PLN and its response values. The preparation was made thrice, and the results were compared with prescribed ones. The deviation between the experimentally obtained values and predicted ones was less than 10%, indicating that the model fit was good.

