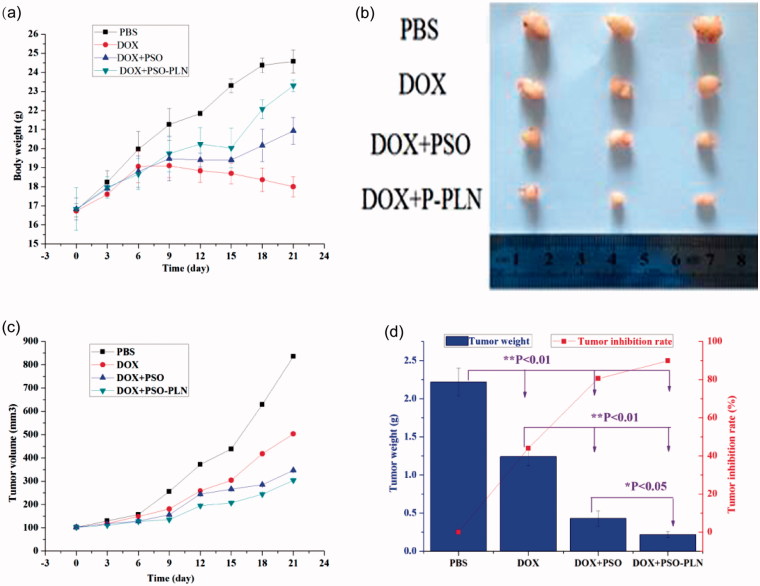
Figure 5.
Evaluation of antitumor efficacy in vivo. (a) Body weight change of mice during various treatments. (b) Photographs of representative tumors from mice bearing MCF-7/ADR xenografts after treatment. (c) Changes in tumor volume of MCF-7/ADR tumor xenograft bearing nude mice from day 1 to day 21. (d) Tumor inhibition rate after antitumor treatment. Data points represent means ± SD, *p < 0.05 is considered statistically significant, n = 4 per group.

