Figure 2.
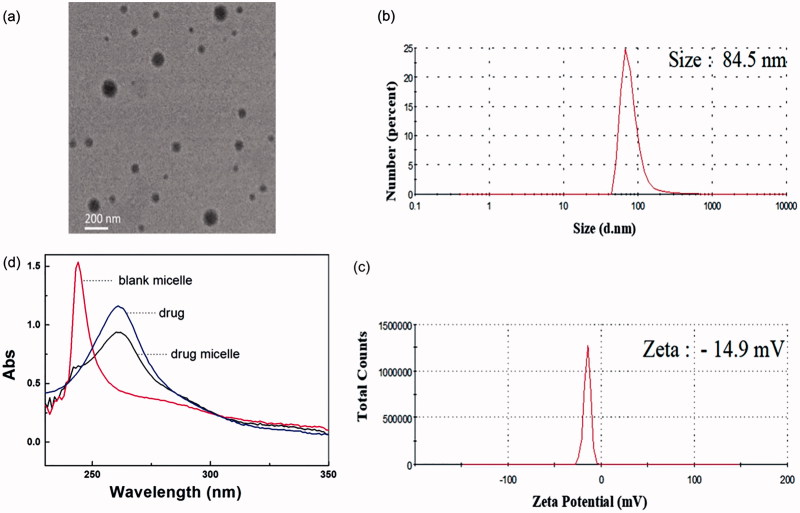
(a) TEM image of genistein/MPEG-b-PAE-g-HA micelles. (b) Particle size and (c) Zeta potential results of genistein/MPEG-b-PAE-g-HA micelle detected by dynamic light scattering. (d) Ultraviolet spectrophotometer of genistein (blue line), blank micelle (red line) and the drug-loaded micelle (black line).

