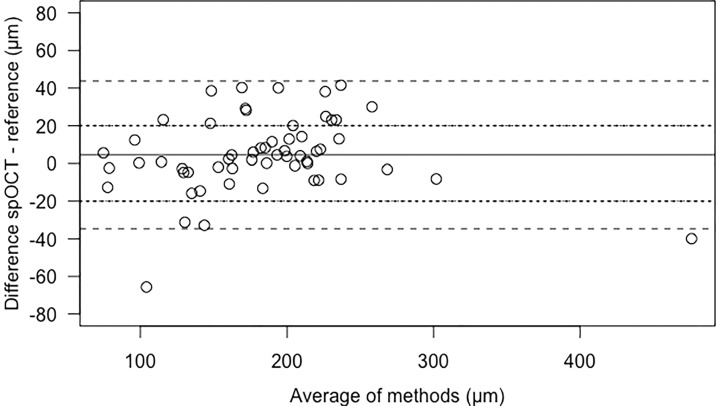
Figure 3.
Bland-Altman plot of difference against the mean of spOCT scanner and Heidelberg Spectralis (reference) measurements of CRT (μm). The lines represent mean difference (solid) and mean ±1.96 standard deviations (dashed) as the 95% limits of agreement. Sixty-nine percent of the differences are in the range of ±20 μm (dotted lines).

