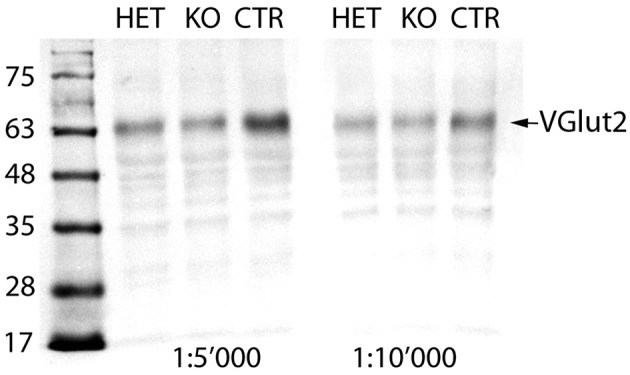
Figure 1.

Immunoblot of brain extracts: In the brain extracts of all three genotypes, the VGlut2 antiserum recognizes a band at MW of ~64 kDa, corresponding to the VGlut2 protein (arrow). The intensity of the band is stronger in the CTR than in both HET and KO mice. Quantification of the band densities with Alpha VIEW software yielded mean quantities of the VGlut2 protein in the KO of 82.7% and in the HET of 86.2% of the CTR values (set to 100%).
