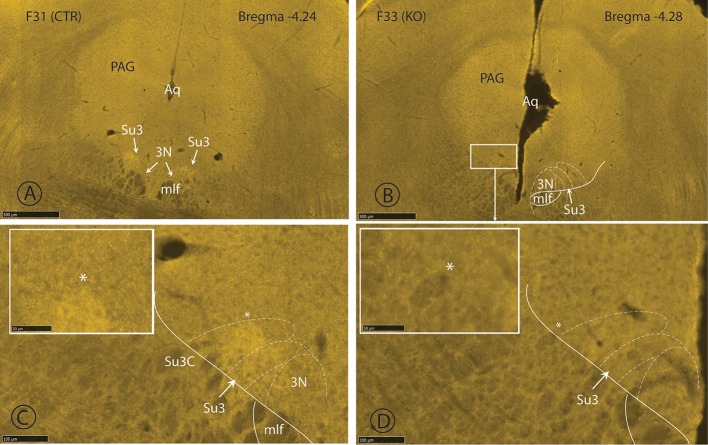
Figure 2.
Immunfluorescence staining with the VGlut-2 antiserum. The two upper nanozoomer images (A,B) show a low magnification of the periaqueductal gray, with the Su3-region demarcated on the right in CTR (A; F31) and KO (B; F33) mice. The Su3 receives inputs from the PV/VGlut2 neurons of the parvafox nucleus of the lateral hypothalamus and we supposed that a difference in density of terminals could be recognized at the light microscopic level. This is indeed the case, the immunolabelling for VGlut2-terminals being more intensive in the CTR (C and terminal density in the inset) than in the KO-Su3 (D and terminal density in the inset). Aq, aqueduct; mlf, medial longitudinal fasciculus; PAG, periaqueductal gray; Su3, supraoculomotor nucleus; Su3C, supraoculomotor cap. The asterisks in the insets indicate the approximate region in (C,D), from which the high magnification image was obtained.

