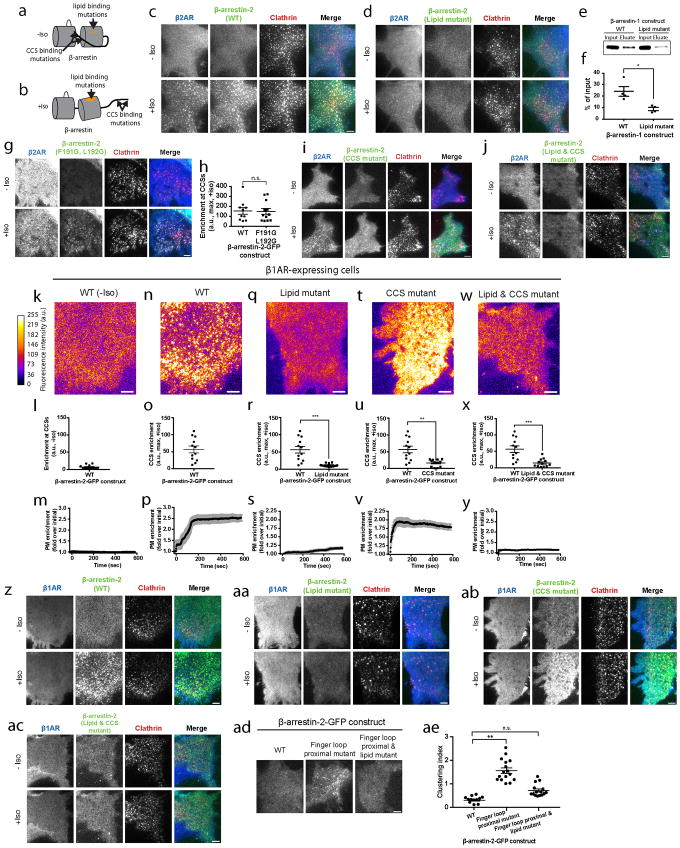
Extended Data Figure 6. Verification that the conserved phosphoinositide binding determinant in the β-arrestin C-domain is specifically required for the catalytic trafficking mechanism and operates upstream of clathrin and AP-2 binding interactions.
Graphical representation of β-arrestin interaction domains without (a) and with (b) βAR activation by isoproterenol. (c) Live cell TIRF microscopy images showing FLAG–β2AR (blue), β-arrestin-2-GFP (green), and clathrin-light-chain–DsRed (red) before and after 10 μM isoproterenol treatment. (d) Live cell TIRF microscopy images showing FLAG–β2AR (blue), β-arrestin-2-GFP lipid mutant (green), and clathrin-light-chain–DsRed (red) before and after 10 μM isoproterenol treatment. (e) Representative western blot (from 4 independent experiments) of purified wild-type and lipid mutant versions of β-arrestin-1(1-393) immunoprecipitation with PIP2-coated agarose beads and quantified in (f) as percent of input protein (n=4 independent experiments, p=0.0142 using a two-tailed unpaired t test). For gel source data, see Supplementary Figure 1. (g) Live cell TIRF microscopy images showing FLAG–β2AR (blue), β-arrestin-2-GFP (F191G, L192G) lipid anchor mutant mutant (green), and clathrin-light-chain–DsRed (red) before and after 10 μM isoproterenol treatment. (h) Maximum β-arrestin-2–GFP enrichment at CCSs in cells expressing the indicated β-arrestin-2–GFP construct and treated with 10 μM isoproterenol (n=12 cells from 3 independent experiments; p=0.9227 calculated using a two-tailed unpaired t test). (i) Live cell TIRF microscopy images showing FLAG–β2AR (blue), β-arrestin-2-GFP CCS mutant (green), and clathrin-light-chain–DsRed (red) before and after with 10 μM isoproterenol. (j) Representative images of HEK 293 cells co-expressing FLAG–β2AR (blue), β-arrestin-2-GFP lipid and CCS mutant (green), and clathrin-light-chain–DsRed (red) before and after with 10 μM isoproterenol. Representative β-arrestin images false colored to indicate fluorescence intensity, maximum fluorescence enrichment at CCSs, and normalized average plasma membrane (PM) β-arrestin-2–GFP fluorescence (data shown as mean ± s.e.m.), respectively, from cells co-expressing FLAG–β1ARs (n=12 cells per condition) without isoproterenol treatment (k–m), and the following β-arrestin-2–GFP constructs with 10 μM isoproterenol treatment: wild-type (n–p), lipid mutant (q–s), CCS mutant (t–v), and CCS and lipid mutant (w–y). Wild-type β-arrestin-2–GFP maximum enrichment at CCSs shown in panels r, u, x is replotted from panel o. Live cell TIRF microscopy images showing cells before and after 10 μM isoproterenol treatment and co-expressing FLAG–β1AR (blue), clathrin-light-chain–DsRed (red), and the following GFP labeled versions of β-arrestin-2 (green): (z) wild-type, (aa) lipid mutant, and (ab) CCS mutant, and (ac) CCS and lipid mutant. (ad) Live cell TIRF microscopy images showing FLAG-β2AR and the indicated β-arrestin-2-GFP construct in the absence of agonist treatment. (ae) Clustering index of β-arrestin-2–GFP for the indicated construct in the absence of agonists treatment. Detailed description of β-arrestin mutations are provided in Extended Data Table 1. (c, d, g, i, j, k, n, q, t, w, z, aa, ab, ac, ad) show representative images from 3 independent experiments. For (r, u, x) n=12 cells from 3 independent experiments; statistical significance was calculated using an unpaired t test with Welch’s correction, p=0.0007, 0.0018, and 0.0012, respectively. For (ae), statistical significance was calculated using an unpaired t test with Welch’s correction, n=12 (WT) and 16 (finger loop proximal mutant) from 3 independent experiments, p<0.0001; n=12 (WT) and 15 (finger loop proximal & lipid mutant) from 3 independent experiments, p=0.5464). WT and finger loop proximal mutant data replotted from Figure 3b. Scatter plots show overlay of mean and s.e.m. Scale bars, 5 μm. ** p < 0.01

