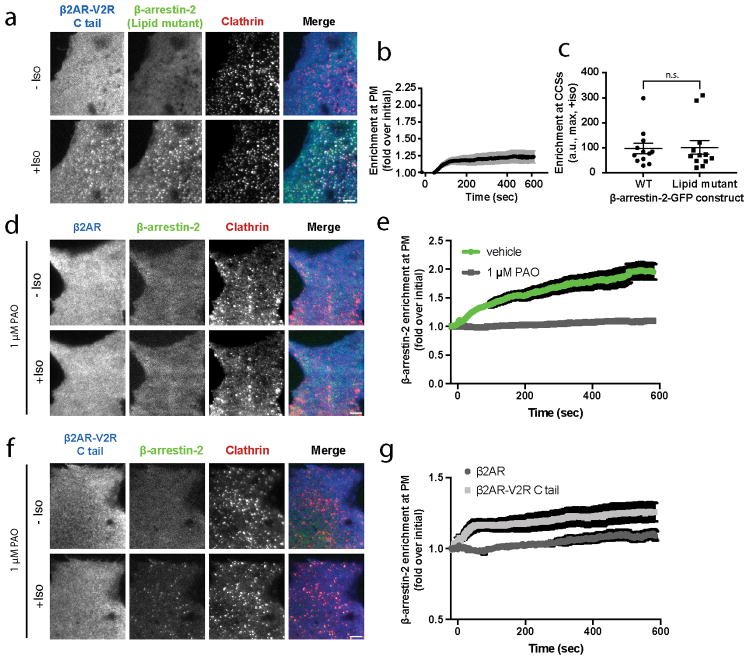
Extended Data Figure 7. Phosphoinositide binding is essential for catalytic activation of β-arrestin trafficking but is dispensable for trafficking mediated by the scaffold mechanism.
(a) Live cell microscopy images of HEK 293 cells co-expressing FLAG–β2AR-V2R C tail (blue), β-arrestin-2-GFP CCS mutant (green), and clathrin-light-chain–DsRed (red) before and after with 10 μM isoproterenol treatment. (b) Normalized plasma membrane (PM) fluorescence of β-arrestin-2–GFP lipid mutant in cells co-expressing FLAG–β2AR-V2R (n=12 cells from 3 independent experiments) when treated with 10 μM isoproterenol. (c) Maximum β-arrestin-2–GFP enrichment at CCSs in cells expressing indicated β-arrestin-2–GFP construct before and after activation of FLAG-β2AR-V2R C tail with 10 μM isoproterenol (n=10, 12 cells, respectively, from 3 independent experiments; p=0.6433 using a two-tailed unpaired t test). (d) Live cell microscopy images of COS-1 cells co-expressing FLAG–β2AR (blue), β-arrestin-2-GFP (green), and clathrin-light-chain–DsRed (red) that have been pre-treated for 1 hour with 1 μM phenylarsine oxide (PAO) or vehicle (DMSO) before 10 μM isoproterenol treatment. (e) Normalized average fold over initial β-arrestin-2–GFP fluorescence in cells co-expressing FLAG–β2AR when pre-treated for 1 hour with 1 μM phenylarsine oxide (PAO) before 10 μM isoproterenol treatment (n=12 cells from 3 independent experiments). (f) Live cell microscopy images of COS-1 cells co-expressing FLAG–β2AR-V2R C tail (blue), β-arrestin-2-GFP (green), and CLC-dsRed (red) that have been pre-treated for 1 hour with 1 μM phenylarsine oxide (PAO) before before 10 μM isoproterenol treatment. (g) Normalized average fold over initial β-arrestin-2–GFP fluorescence in cells co-expressing FLAG–β2AR or FLAG–β2AR-V2R when pre-treated for 1 hour with 1 μM phenylarsine oxide (PAO) before 10 μM isoproterenol treatment (n=12 cells from 3 independent experiments). (a, d, f) show representative images from 3 independent experiments. (b, e, g) show data as mean ± s.e.m. Scatter plots show overlay of mean and s.e.m.

