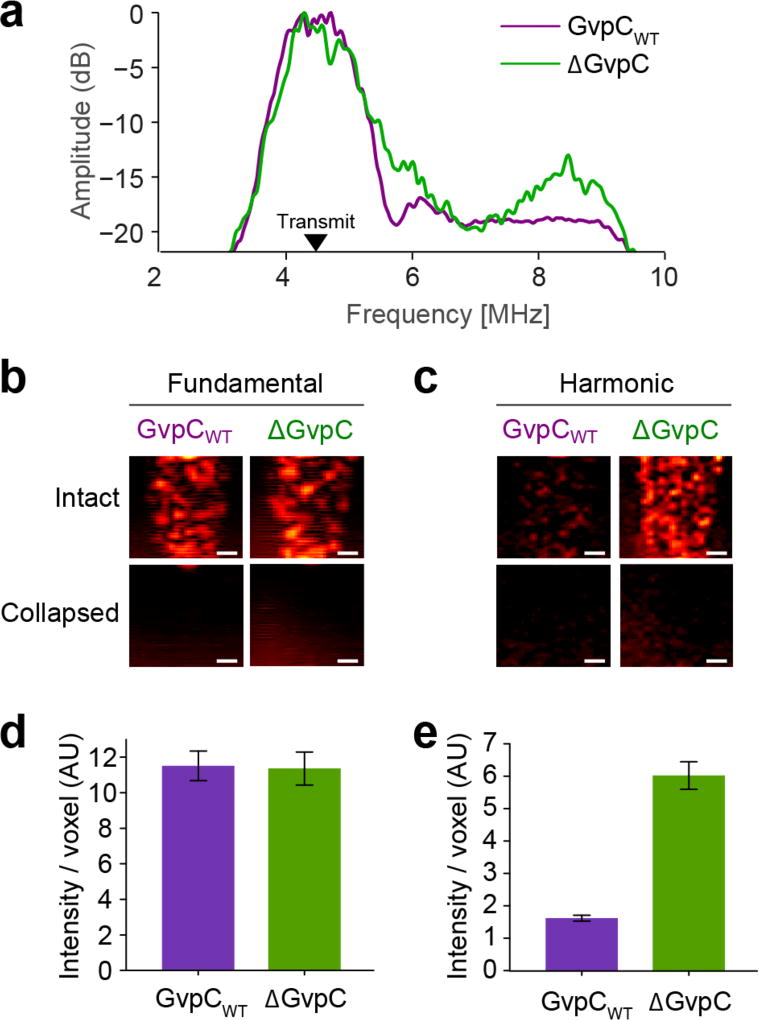
Figure 3. GV engineering enables modulation of harmonic signals in vitro.
(a) Power spectrum of signal backscattered from ΔGvpC (green) and GvpCWT (purple) variants in an agarose phantom in response to 4.46 MHz pulses. (b) Fundamental and (c) second harmonic ultrasound images of ΔGvpC and GvpCWT GVs acquired with 4.46 MHz transmission and band-pass filtered around 4.46 and 8.92 MHz respectively. Images are shown before and after collapse using a high power burst from the transducer to collapse the GVs. Scale bars are 1 mm. (d) Mean fundamental and (e) harmonic signals from ΔGvpC and GvpCWT variants after filtering at the indicated frequencies (N = 7 independent measurements, error bars are SEM). Data in all panels comes from GVs prepared at OD 2.5 in PBS and loaded into 1% agarose phantoms.

