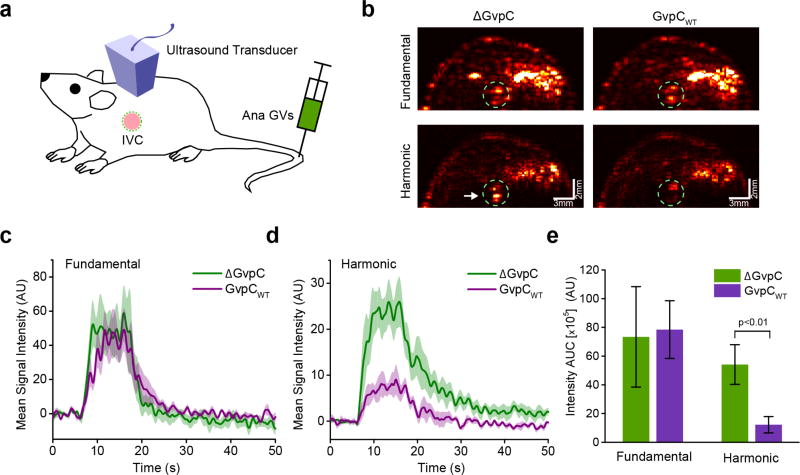
Figure 4. GV engineering enables modulation of harmonic signals in vivo.
(a) Schematic depiction of intravenous GV injection and in vivo ultrasound imaging during passage through the inferior vena cava (IVC). (b) Fundamental and second harmonic ultrasound images taken at 4.46 MHz transmission frequency and band-pass filtered receive around 4.46 and 8.92 MHz respectively. Engineered Ana GVs at OD 23.5 in PBS were used for injections. The IVC ROI used for subsequent analysis is circled in green. The white arrow points to the increased harmonic signal observed in the IVC for the ΔGvpC variant. Time course of the mean (c) fundamental and (d) harmonic acoustic signal in the IVC before, during and after steady infusion, with shaded regions representing SEM (N = 6 mice). (e) Histogram showing the area under the curve (AUC) of average fundamental and harmonic contrast in the IVC after ΔGvpC and GvpCWT GV injections (N=6, error bars are SEM).

