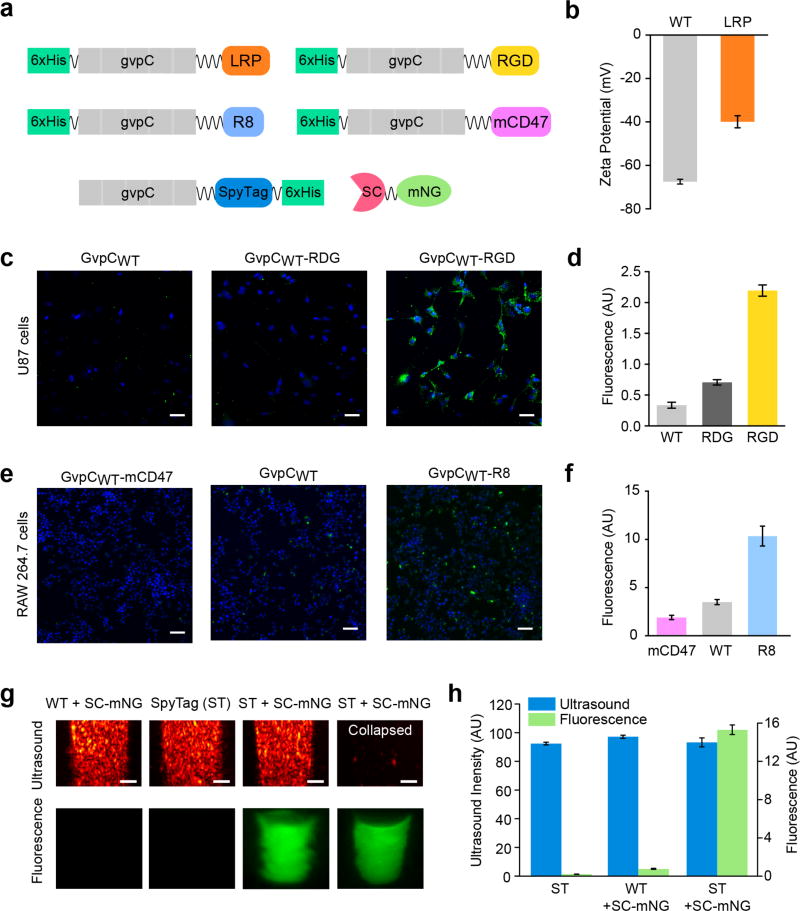
Figure 5. Genetic engineering of GV surface properties, cellular targeting and multimodal imaging.
(a) Diagram of GvpC genetic fusions used to engineer novel GV properties and functions. (b) Zeta potential measurements of engineered GVs having GvpC fused to LRP and wild-type GvpC (N = 4, error bars are SEM) (c) Confocal fluorescence images showing RGD-functionalized, RDG-functionalized and wild-type Alexa Fluor-488 fluorescently labeled (green) GVs after 24 hr incubation with U87 glioblastoma cells (DAPI-stained nuclei, blue). Scale bars are 50 µm (d) Mean GV fluorescence measured for each condition in (c) (N = 3, error bars are SEM). (e) Confocal fluorescence images of RAW 264.7 macrophages (DAPI-stained nuclei, blue) incubated for 30 min with fluorescently labeled GVs (green) displaying GvpC fused to mCD47, R8 or wild-type GvpC. Scale bars are 50 µm. (f) Mean GV fluorescence measured for each condition in (e) (N = 3, error bars are SEM). (g) Top panel: Ultrasound images of engineered and SpyCatcher-mNeonGreen (SC-mNG) reacted GVs at OD 2.5 in PBS, acquired using a 19 MHz transmission pulse in fundamental mode. Scale bars are 1 mm. Bottom panel: Fluorescence images of the agarose phantoms before and after acoustic collapse. (h) Mean ultrasound and fluorescence signals from the GV samples tested in (g). (N ≥ 4, error bars are SEM).

