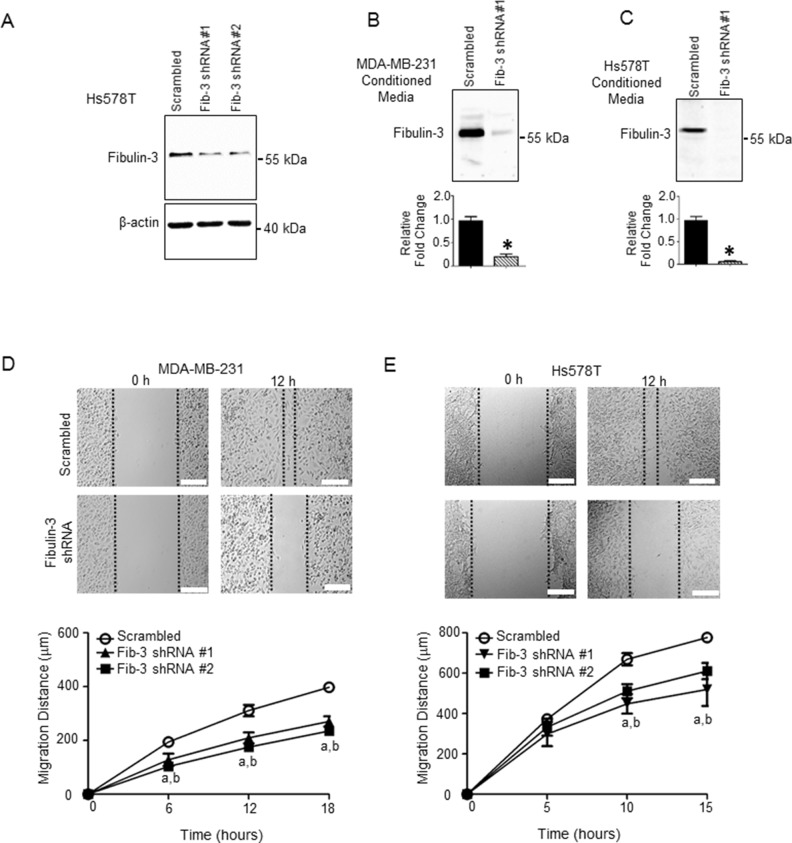
Figure 3. Fibulin-3 knockdown in TNBC cells decreases TNBC cell motility.
(A) Representative western blot showing the expression of fibulin-3 in Hs578T cells stably expressing fibulin-3 shRNA or scrambled control; β-actin, loading control. See Supplementary Figure 2B for densitometric analysis of blots (n = 3). Representative western blot showing fibulin-3 expression in conditioned media from (B) MDA-MB-231 and (C) Hs578T cells stably expressing fibulin-3 shRNA or scrambled control. Densitometric analysis of blots shown below. Student’s t-test: *, P < 0.05. Bars represent protein expression ± SEM (n = 5). Cell motility measured using the scratch assay in (D) MDA-MB-231 and (E) Hs578T cells expressing fibulin-3 shRNA vs. scrambled control (n = 4). Two-way ANOVA followed by Bonferroni’s multiple comparison test: a, P < 0.05 for fibulin-3 shRNA construct #1 vs. scrambled control; b, P < 0.05 for fibulin-3 shRNA construct #2 vs. scrambled control. Scale bar = 50 μm.

