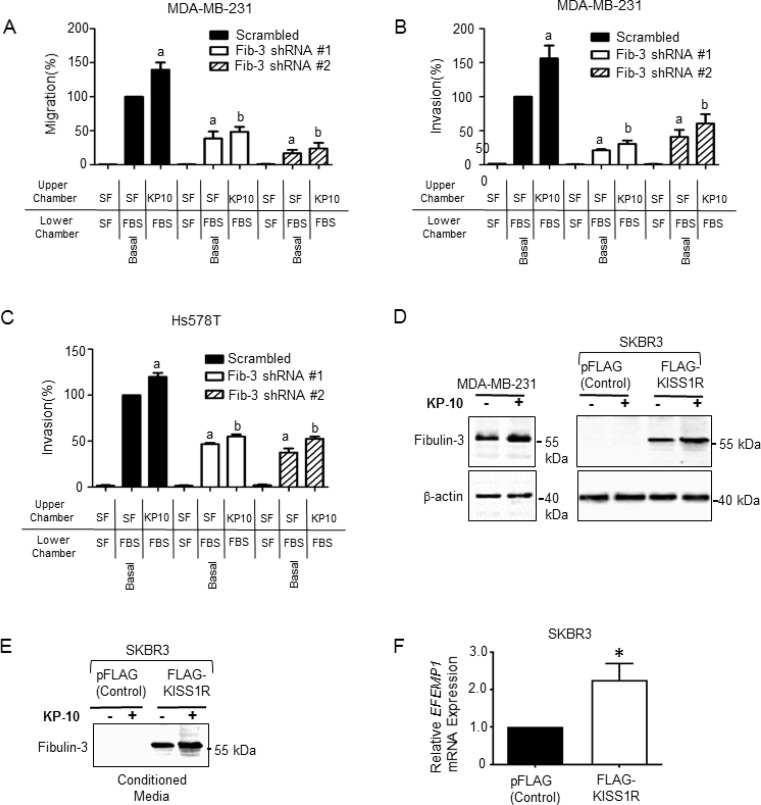
Figure 5. Fibulin-3 knock-down inhibits kisspeptin induced TNBC cell migration and invasion.
(A) MDA-MB-231 cells expressing fibulin-3 shRNA display decreased migration towards 10% fetal bovine serum (FBS) under basal and KP-10 stimulated conditions (n = 3). One-way ANOVA followed by Bonferroni’s multiple comparison test: a, P < 0.05 for significance difference vs scrambled control non-stimulated; b, P < 0.05 for significance difference vs scrambled control 100 nM kisspeptin-10. Bars represent cells migrated to lower chamber ± SEM, as percentage of control. (B) MDA-MB-231 cells and (C) Hs578T cells depleted of fibulin-3 display decreased invasion towards 10% FBS under basal conditions and KP-10 induced conditions (n = 3). One-way ANOVA followed by Bonferroni’s multiple comparison test: a, P < 0.05 for significance difference vs scrambled control non-stimulated; b, P < 0.05 for significance difference vs scrambled control 100 nM kisspeptin-10. Bars represent cells invaded to lower chamber ± SEM, as percentage of control. (D) KP-10 stimulates the expression of fibulin-3 in ERα-negative breast cancer cells. Representative western blot showing expression levels of fibulin-3 in cells stimulated with KP-10 (100 nM, 72 hours). (E) KP-10 stimulates the secretion of fibulin-3 in ERα-negative SKBR3 breast cancer cells. Representative western blot of cell lysates showing fibulin-3 in conditioned media from ER-α negative SKBR3 breast cells (100 nM, 24 hours). (F) Relative mRNA expression of fibulin-3 gene, EFEMP1 by RT-qPCR in SKBR3 cells stably expressing KISS1R and pFLAG vector controls. Columns represent mean relative mRNA expression, normalized to GAPDH ± SEM; student’s unpaired T-test: *P < 0.05. (n = 5). See Supplementary Figure 3A–3C for densitometric analysis of blots.

