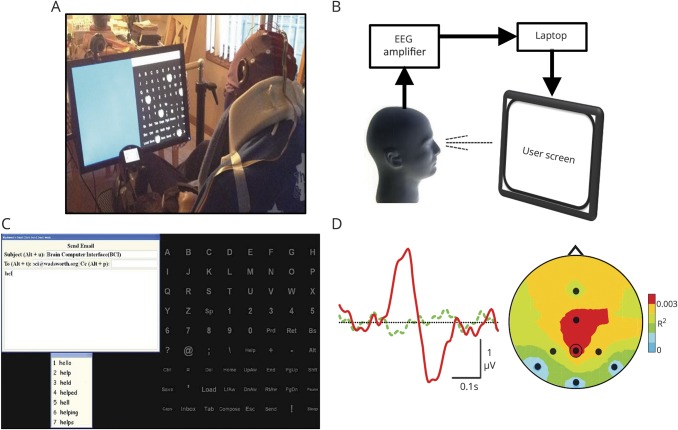
Figure 1. BCI system and its operation.
(A) A home user operating the brain-computer interface (BCI). (B) The EEG amplifier amplifies and digitizes the 8 EEG channels. The laptop computer analyzes the EEG, controls the user screen, and stores all data. (C) BCI operation illustrated with the e-mail application. The 72-item matrix of possible selections (i.e., letters, numbers, functions) is equivalent to a full keyboard. To make a selection, the user pays attention to the desired item as groups of items flash in rapid succession. The e-mail message appears at the top left. A predictive speller option (Word Q3; Mayer-Johnson) is at the bottom left (e.g., after spelling “hel,” the user can complete the word “hello” simply by selecting the numeral 1). (D) BCI detection of the user's selection. (Left) The user's average EEG response at location Pz to the flash of a group of items that includes the desired item (solid red) differs from the average response to the flash of a group that does not include it (dashed green). The BCI detects this difference and selects the desired item. (Right) Topographic distribution (238 milliseconds after flash; nose at top) of the difference between the 2 responses (measured as R2). The EEG recording sites are indicated (Pz is circled). The difference between the responses has a typical posterior-central focus. See elsewhere23–26 for details.

