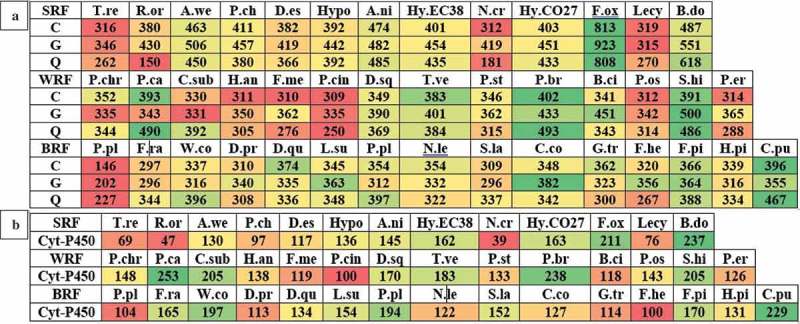
Figure 2.

Heatmaps showing the genome-wide distribution of (a) metabolism (C = energy production and conversion, G = carbohydrate transport and metabolism and Q = secondary metabolites biosynthesis, transport and catabolism) and (b) number of cytochrome P450-encoding genes in selected popular white rot, brown rot and soft rot fungi.
