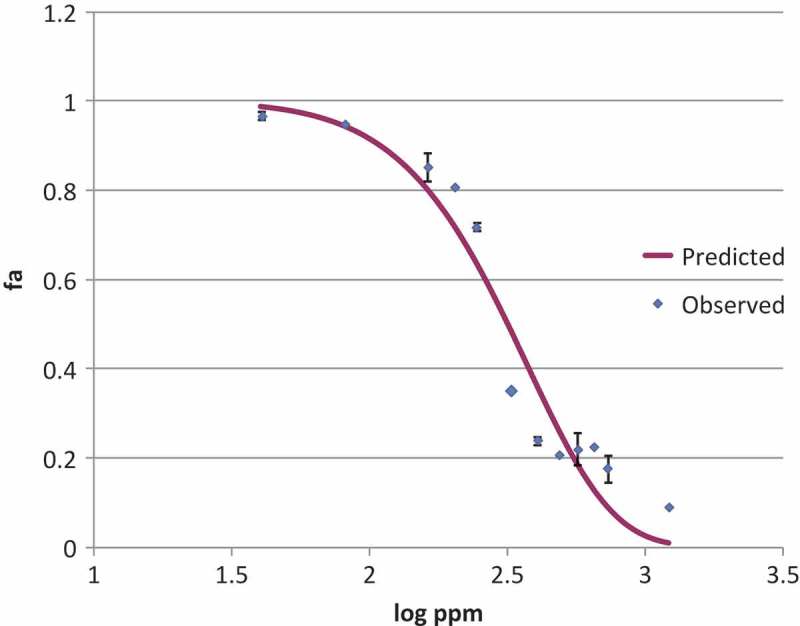
Figure 2.

Inhibition profile of ZnO nanoparticles against P. expansum. Scattered points represent the averages of the observed values of estimated fractional area, continuous line represents the predicted values obtained from the LPM. The mean squared error (MSE) was 0.08.
