
Figure 4.
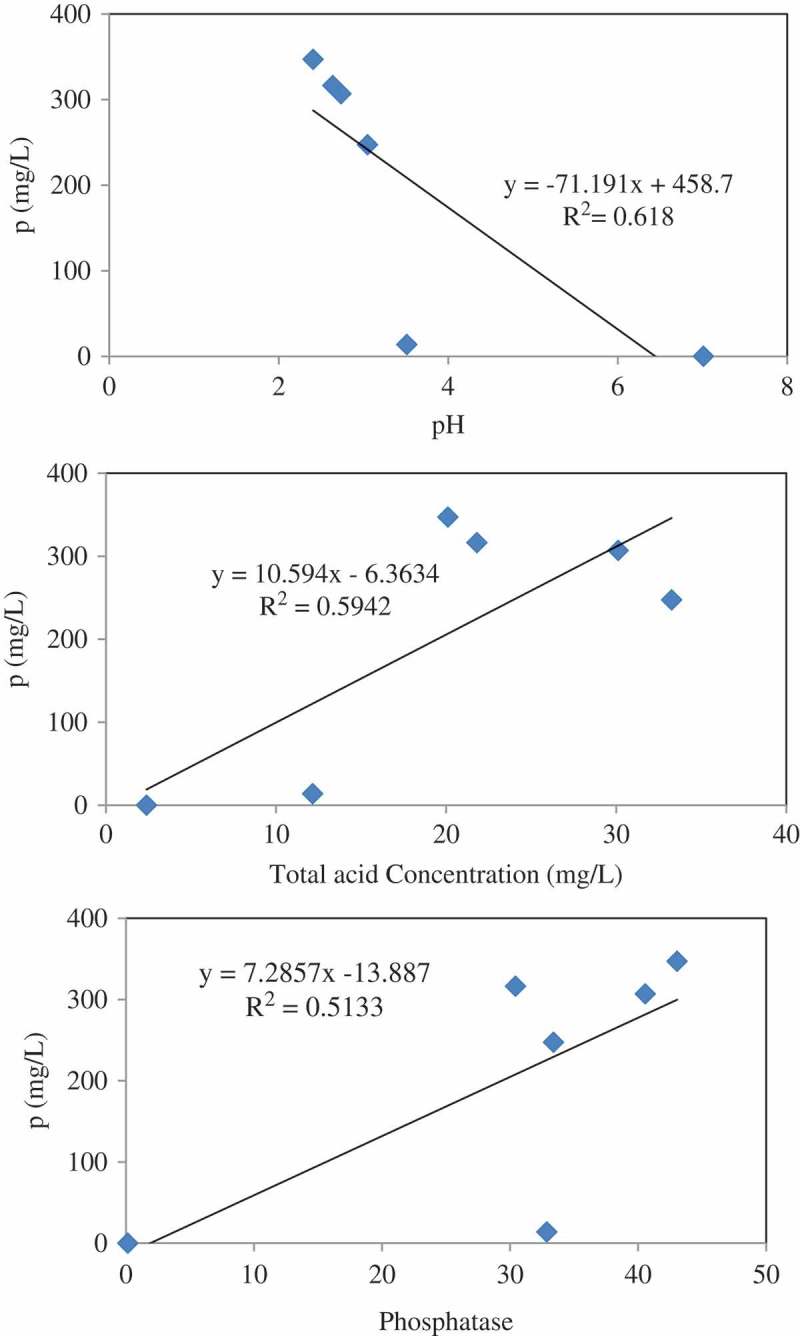
Relationship between pH (a), organic acid (b) and acid phosphatase (c) of bacterial culture and solubilised P. Each value represents the mean of three replicates with standard deviation shown by error bars.
Official websites use .gov
A
.gov website belongs to an official
government organization in the United States.
Secure .gov websites use HTTPS
A lock (
) or https:// means you've safely
connected to the .gov website. Share sensitive
information only on official, secure websites.
Relationship between pH (a), organic acid (b) and acid phosphatase (c) of bacterial culture and solubilised P. Each value represents the mean of three replicates with standard deviation shown by error bars.