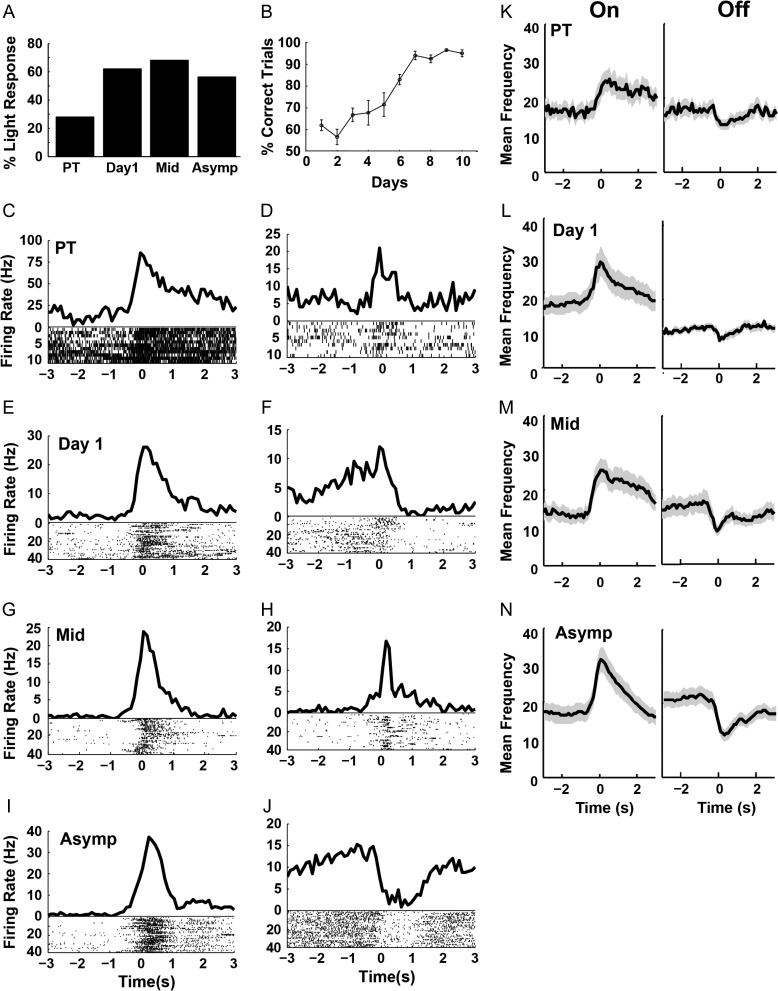
Figure 2.
Responses to light cue during cued T-maze performance. Plot A illustrates percentage of neurons with a significant response to the light cue at each stage of training, including the pretraining session (PT), the first day, the middle training session (Mid) and during asymptotic performance (Asymp). Plot B illustrates the average percentage of correct choices across training stages. Plots C–J illustrates peri-event time histograms of example light responses from individual neurons (light onset occurs at time zero on the x-axis), with examples from each stage of training. Plots K–N illustrate the average firing rate of all neurons with significant light responses, shown for each stage of training and separately plotted for neurons with “On” and “Off” responses (shading indicates SEM).

