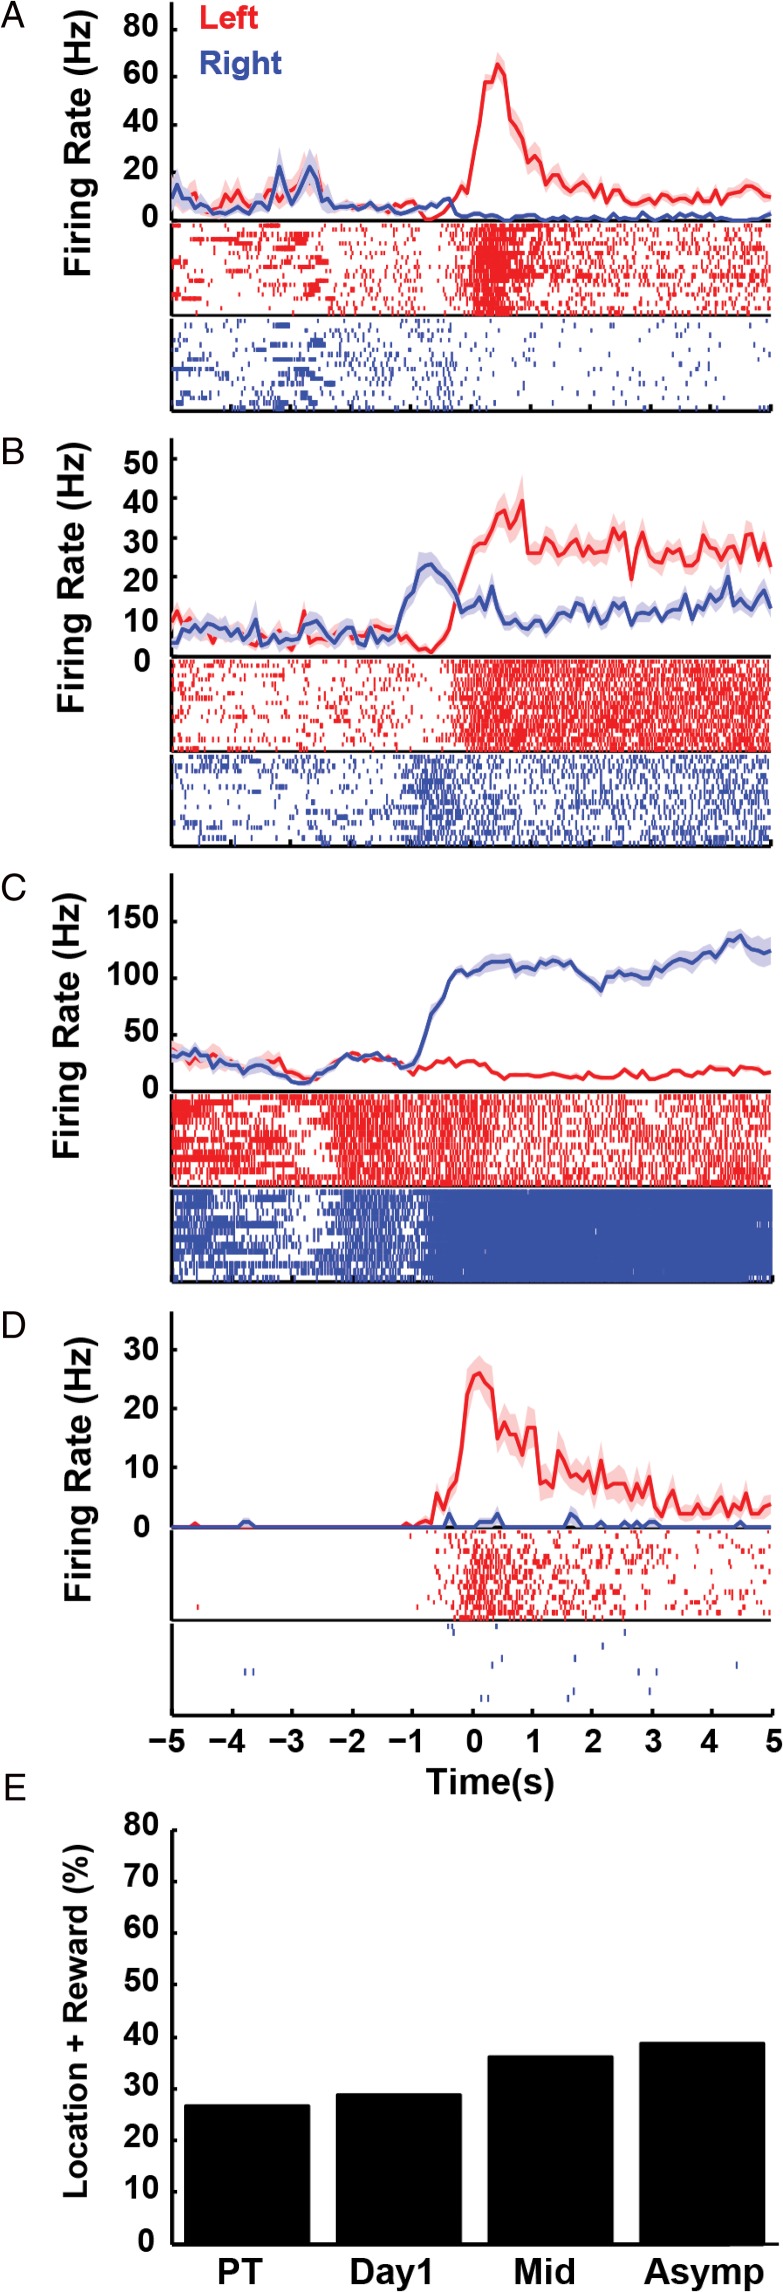
Figure 3.
Location-specific reward responses in the RSC. Peri-event time histograms illustrating reward responses that differentiated the left and right reward locations for four different example neurons are shown in plots A–D (reward occurs at time zero on the x-axis, shading indicates SEM). Left and right rewarded trials are plotted separately in red and blue in the histogram and sorted in the raster display (for illustration, the order of left and right trials was randomized). Plot E illustrates the percentage of RSC neurons with location-specific reward responses. A color version of this figure is available in the online version of this article.

