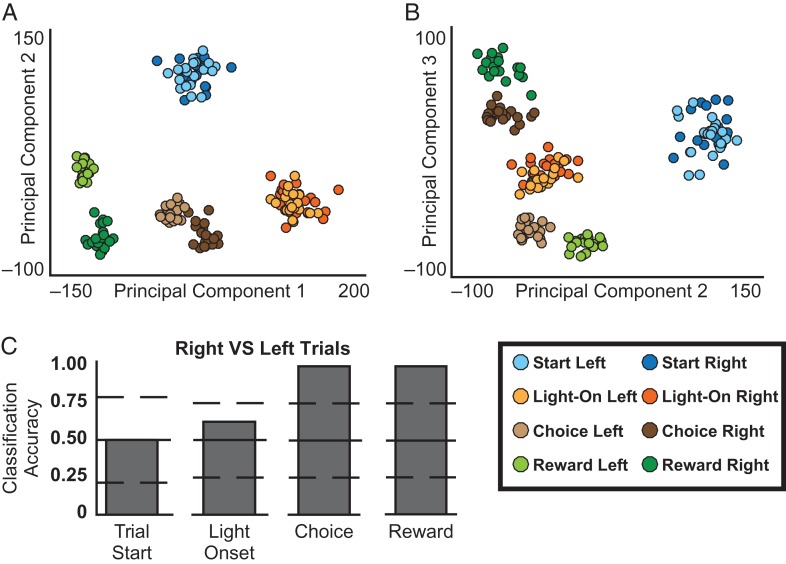
Figure 5.
Ensemble coding of task events. Population vectors containing firing rates of 246 neurons (all rats and sessions of asymptotic performance) were subjected to principal components analysis. Plots of the principal components 1–3 are shown in A and B, with each dot representing data from a single trial. Dots are color coded for the events (Trial Start, Light Onset, Choice and Reward) with light and dark colors indicating left and right trials. Distinct clusters are seen for the trial start and the light onset, which did not differ with regard to left and right trials. Separate clusters are seen for left and right trials at the time of the reward and arrival at the choice point. Linear discriminant analysis was able to correctly classify each of the four events for every test trial (not shown, see text). Plot C illustrates classifier accuracy for distinguishing left and right trials for each event. The classifier performed at chance levels at the trial start (before the cue light was illuminated) and at light onset (mean and 95% confidence intervals of shuffled data are indicated by the horizontal solid and dashed lines, respectively). The classifier perfectly distinguished left and right trials at the choice point and the reward. A color version of this figure is available in the online version of this article.

