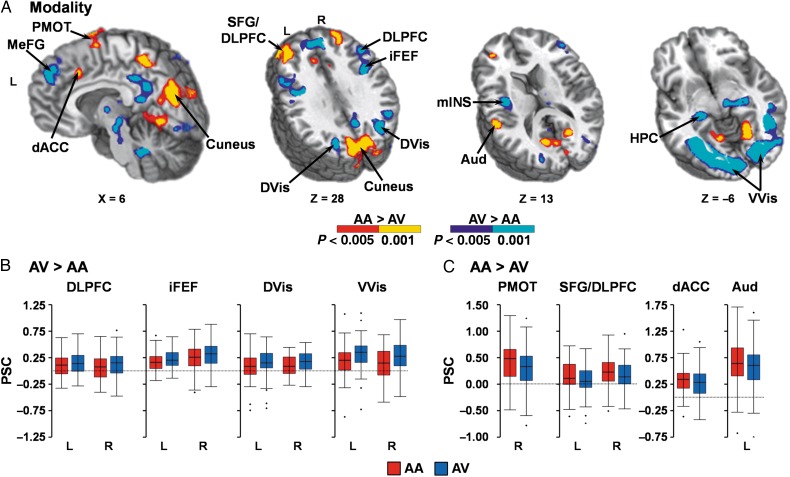
Figure 3.
(A) presents significant regions (minimum P < 0.005 and minimum cluster size = 1088 µL) exhibiting greater activation for either attend-auditory (AA) relative to attend-visual (AV) trials (P < 0.005: red; P < 0.001: yellow) or for AV relative to AA trials (P < 0.005: blue; P < 0.001: cyan). Regions exhibiting increased activation during AV trials (B) included the medial frontal gyrus (MeFG), dorsolateral prefrontal cortex (DLPFC), inferior frontal eye fields (iFEF), mid-insula (mINS), hippocampi (HPC), primary visual cortex extending into ventral visual stream (VVis), and dorsal visual stream (DVis). Regions exhibiting increased activation during AA trials (C) included the superior frontal gyrus (SFG) extending into the DLPFC, dorsal anterior cingulate cortex (dACC), left primary and secondary auditory cortex (Aud), right premotor cortex (PMOT) and cuneus. Locations of the sagittal (X) and axial (Z) slices are given according to the Talairach atlas for the left (L) and right (R) hemispheres. Percent signal change (PSC) values for selected regions are presented in B,C (AA = red; AV = blue).

