Figure 5.
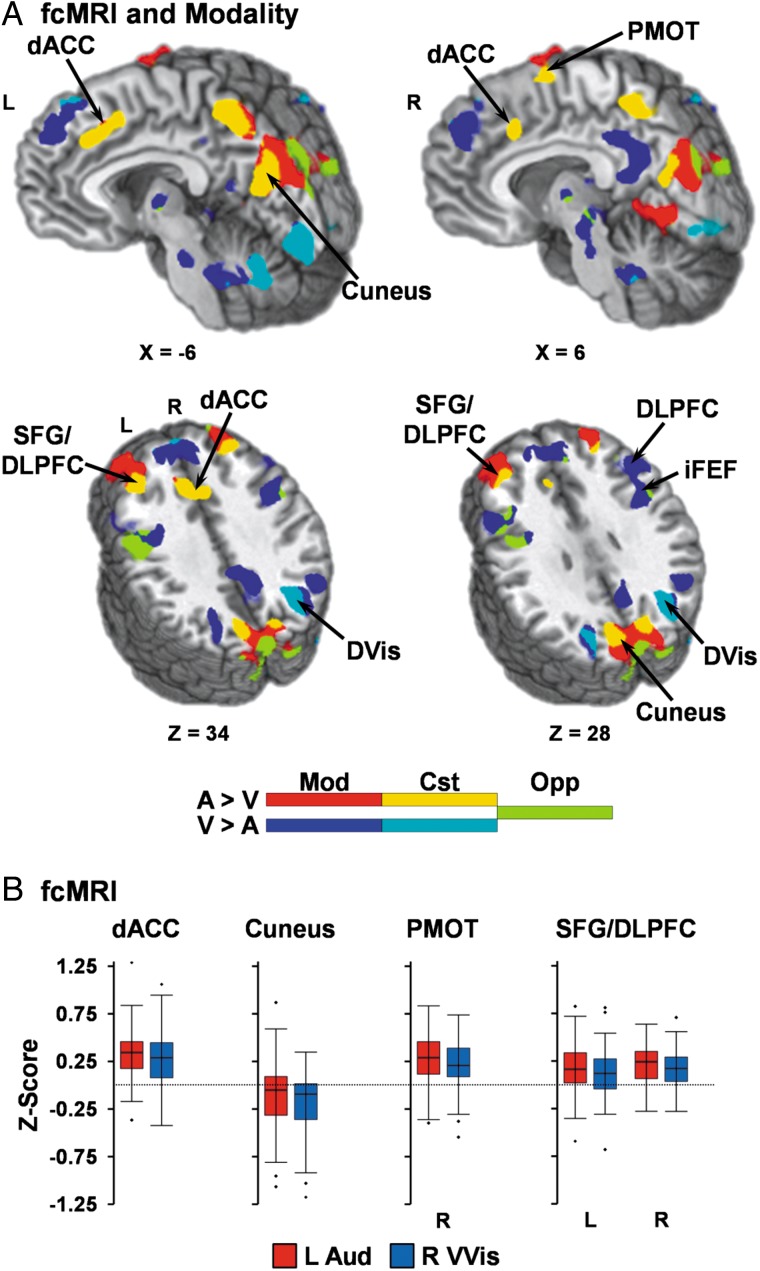
(A) compares significant (minimum P < 0.005 and minimum cluster size = 1088 µL) connectivity (fcMRI) results from the left auditory (L Aud) versus right primary/secondary/ventral visual (R VVis) seeds with results from the main effect of modality (Mod). Locations of sagittal (X) and axial (Z) slices are given according to the Talairach atlas for the left (L) and right (R) hemispheres. Regions that exhibited activation only during the main effect of modality are depicted in red (attend-auditory (AA) > attend-visual (AV)) or dark blue (AV > AA). Regions that exhibited consistent (Cst) task/fcMRI effects are depicted in yellow for auditory (A) inputs (AA > AV and L Aud > R VVis) or cyan for visual (V) inputs (AV > AA and R VVis > L Aud). Finally, regions demonstrating opposing (Opp) modality-specific and fcMRI activation (e.g., AV > AA and L Aud > R VVis) are depicted in chartreuse. (B) depicts fcMRI strength (Fisher Z-scores) for auditory (red) or visual (blue) seeds in regions exhibiting consistent effects for auditory inputs (A) including bilateral superior frontal gyrus (SFG)/dorsolateral prefrontal cortex (DLPFC), dorsal anterior cingulate (dACC), right premotor cortex, and cuneus.

