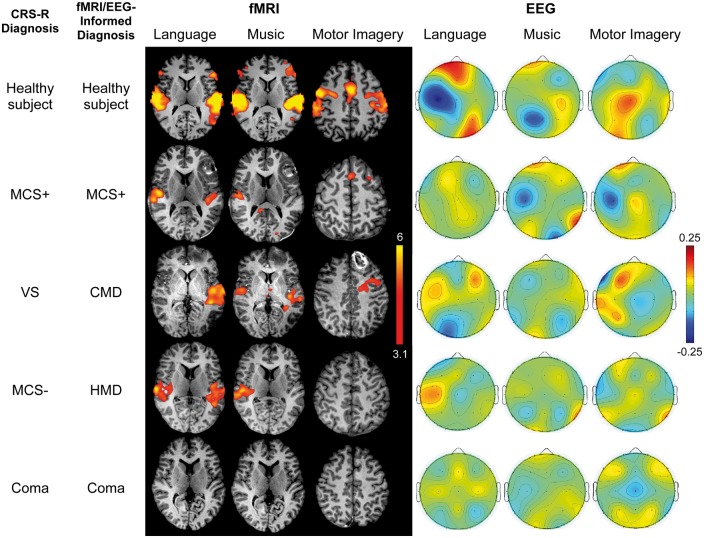
Figure 3.
Stimulus-based functional MRI responses and EEG topographic plots. Functional MRI (fMRI) and EEG results are shown for the language, music and motor imagery paradigms for representative subjects: a healthy subject (C2), a patient with behavioural and functional MRI/EEG evidence of language function (Patient P9), a patient with no behavioural evidence of language but functional MRI evidence of command-following (CMD; Patient P6), a patient with no behavioural evidence of language but functional MRI/EEG evidence of cortical activation to passive stimuli (HMD; Patient P2), and a patient without behavioural or functional MRI/EEG evidence of language (Patient P3). Functional MRI data are shown as Z-statistic images to demonstrate stimulus-specific responses. Z-statistic images are thresholded at cluster-corrected Z scores of 3.1 (inset colour bar) and superimposed on T1-weighted axial images. All EEG data are shown as topographic plots illustrating the averaged weights attributed to each electrode by the classifier, based on their ability to differentiate between the two conditions for each paradigm (e.g. language versus rest). Red colours show coefficient values > 0. Blue colours show values < 0 (inset colour bar). The larger the absolute value of a feature weight (either positive or negative), the more important it was for discriminating between stimulus and rest conditions. Functional MRI data are in radiological convention; EEG data are in anatomical convention.

