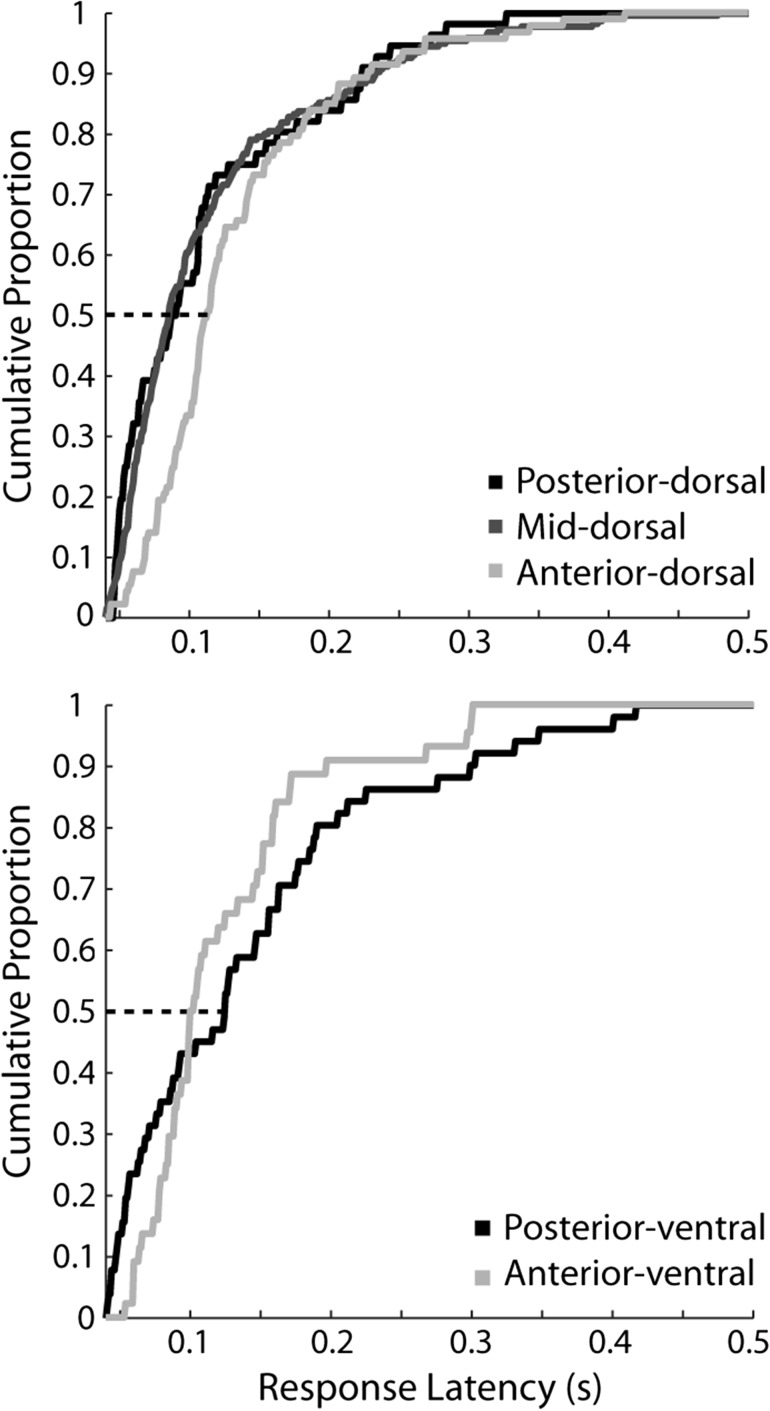
Figure 5.
Cumulative distribution of neuron latencies for the dorsal (top) and ventral (bottom) regions. Latencies were calculated using neurons that responded to any stimulus, tested with each neuron's preferred stimulus, across all sets tested (N = 67 posterior-dorsal, N = 264 mid-dorsal, N = 123 anterior-dorsal, N = 70 posterior-ventral, and N = 52 anterior-ventral). The dotted line represents the point at which half of the population of neurons has responded to the stimulus.

